
When I’m talking to network engineers about documenting the network, I always ask the following question, “what does network documentation mean to you?”
The responses I get range from:
- “I just want to document my routers and switches and be able to show this to management”
- ”I need to document everything — from office workstations, printers, wall jacks, to wiring closets, telecom rooms, and show things are connected.”
- “I need to create network topology maps and be able to share the network’s diagrams.”
As you can see, network documentation really can vary widely.
How detailed you get about the network, and what kinds of diagrams you can create, depends on your tools and your needs.
You can document without any automation — for example, you could use Visio or spreadsheets. If you’re using software, some tools include basic workflows which you can create. On the other end of the spectrum, you have software vendors that offer fully loaded feature-rich systems that offer network monitoring/management with bandwidth utilization, workflows, up and down status. Other tools may consider network documentation to be the ability to show cables inside racks and see how things are connected (including DCIM); we call that cable management (click here for more information).
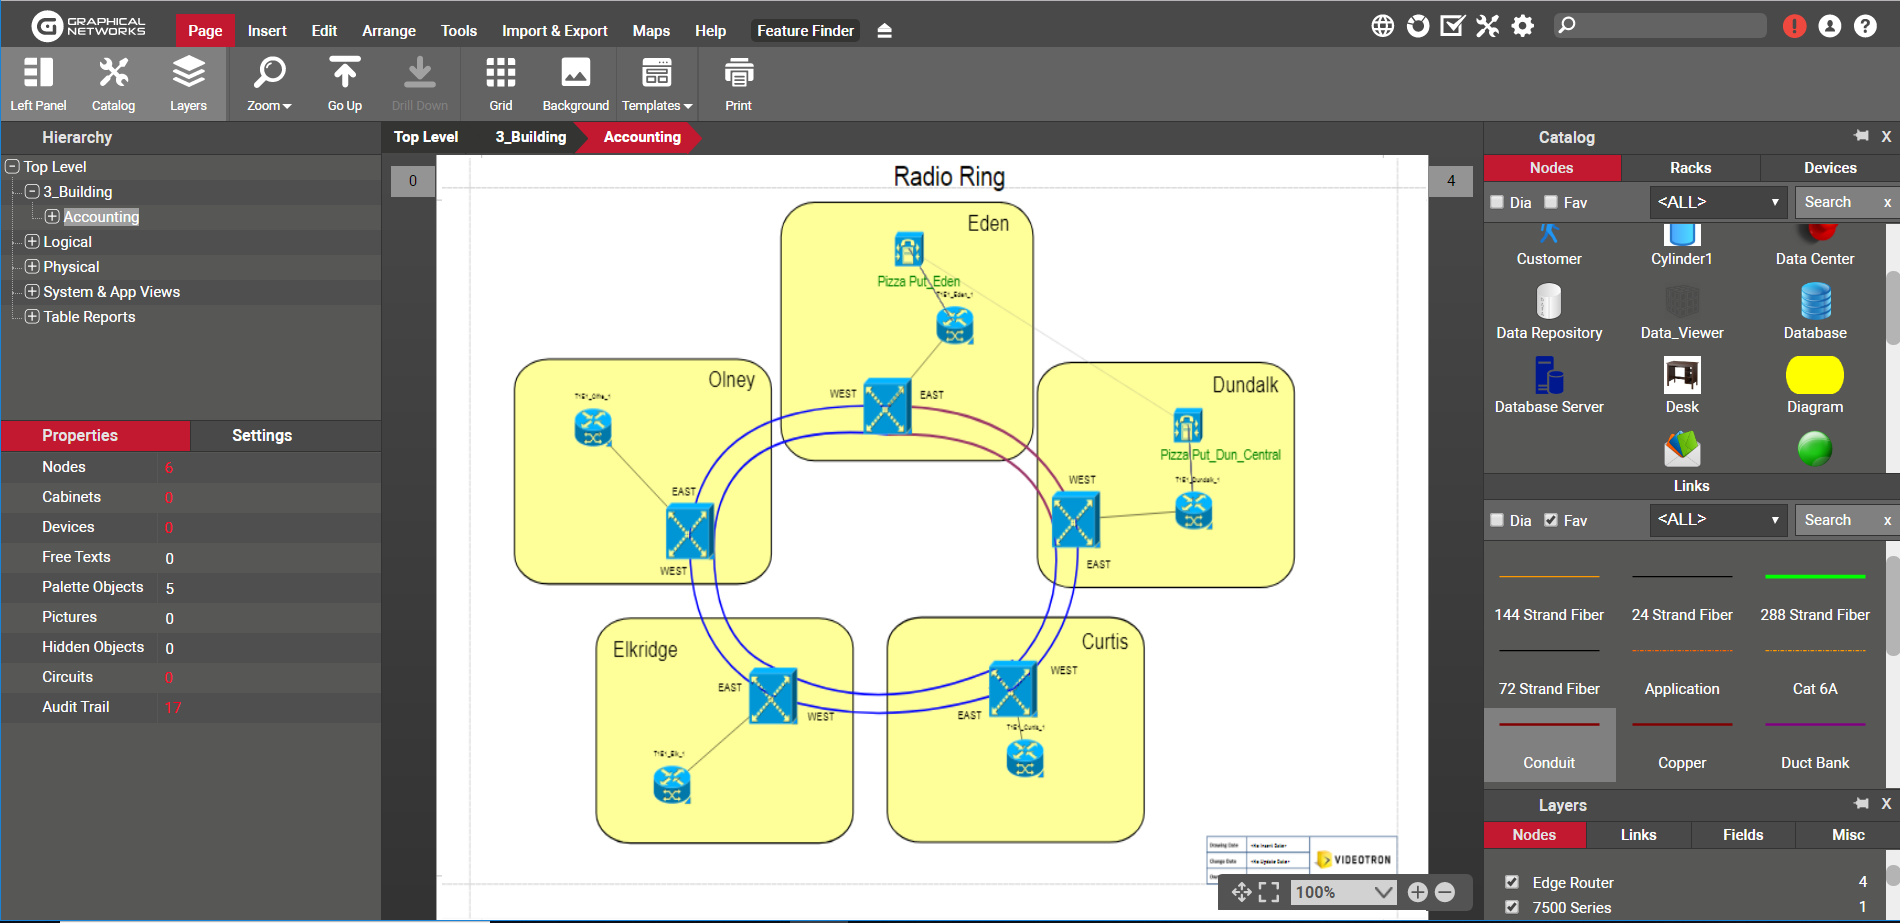 Example of a Logical Network View in netTerrain
Sometimes people confuse network documentation with network management. Is it the same? Not really. In a past article, I dived into the differences between network monitoring and network documentation, and you can check that out by clicking here.
So…if there are a number of different things that it can be, how do you define network documentation?
- Network documentation can be manually drawn network diagrams
- Network documentation can mean the ability to diagram and map the network the way you want/need to see it
- Network documentation can be the ability to see data-driven diagrams with up-to-date information
As you can see, network documentation can be as simple or powerful as you need it to be.
Different software vendors offer different capabilities. You could, for example, marry Visio diagrams with the ability to bring in data from your other data sources, or through a SNMP network discovery, and to add your own custom fields and attributes, and to create your own diagrams. This is what our IT/ network diagram and documentation software netTerrain is really all about: netTerrain gives you the ability to create your own web-based diagrams (i.e. network topology maps, data center/telecom rooms with racks, office floors, etc.), the ability to create any type of connections (all the way down to fiber strands and port level if desired), add any custom fields or attributes (like cost, if it’s under warranty, etc.), and the ability to add your own models, and request device models to be added.
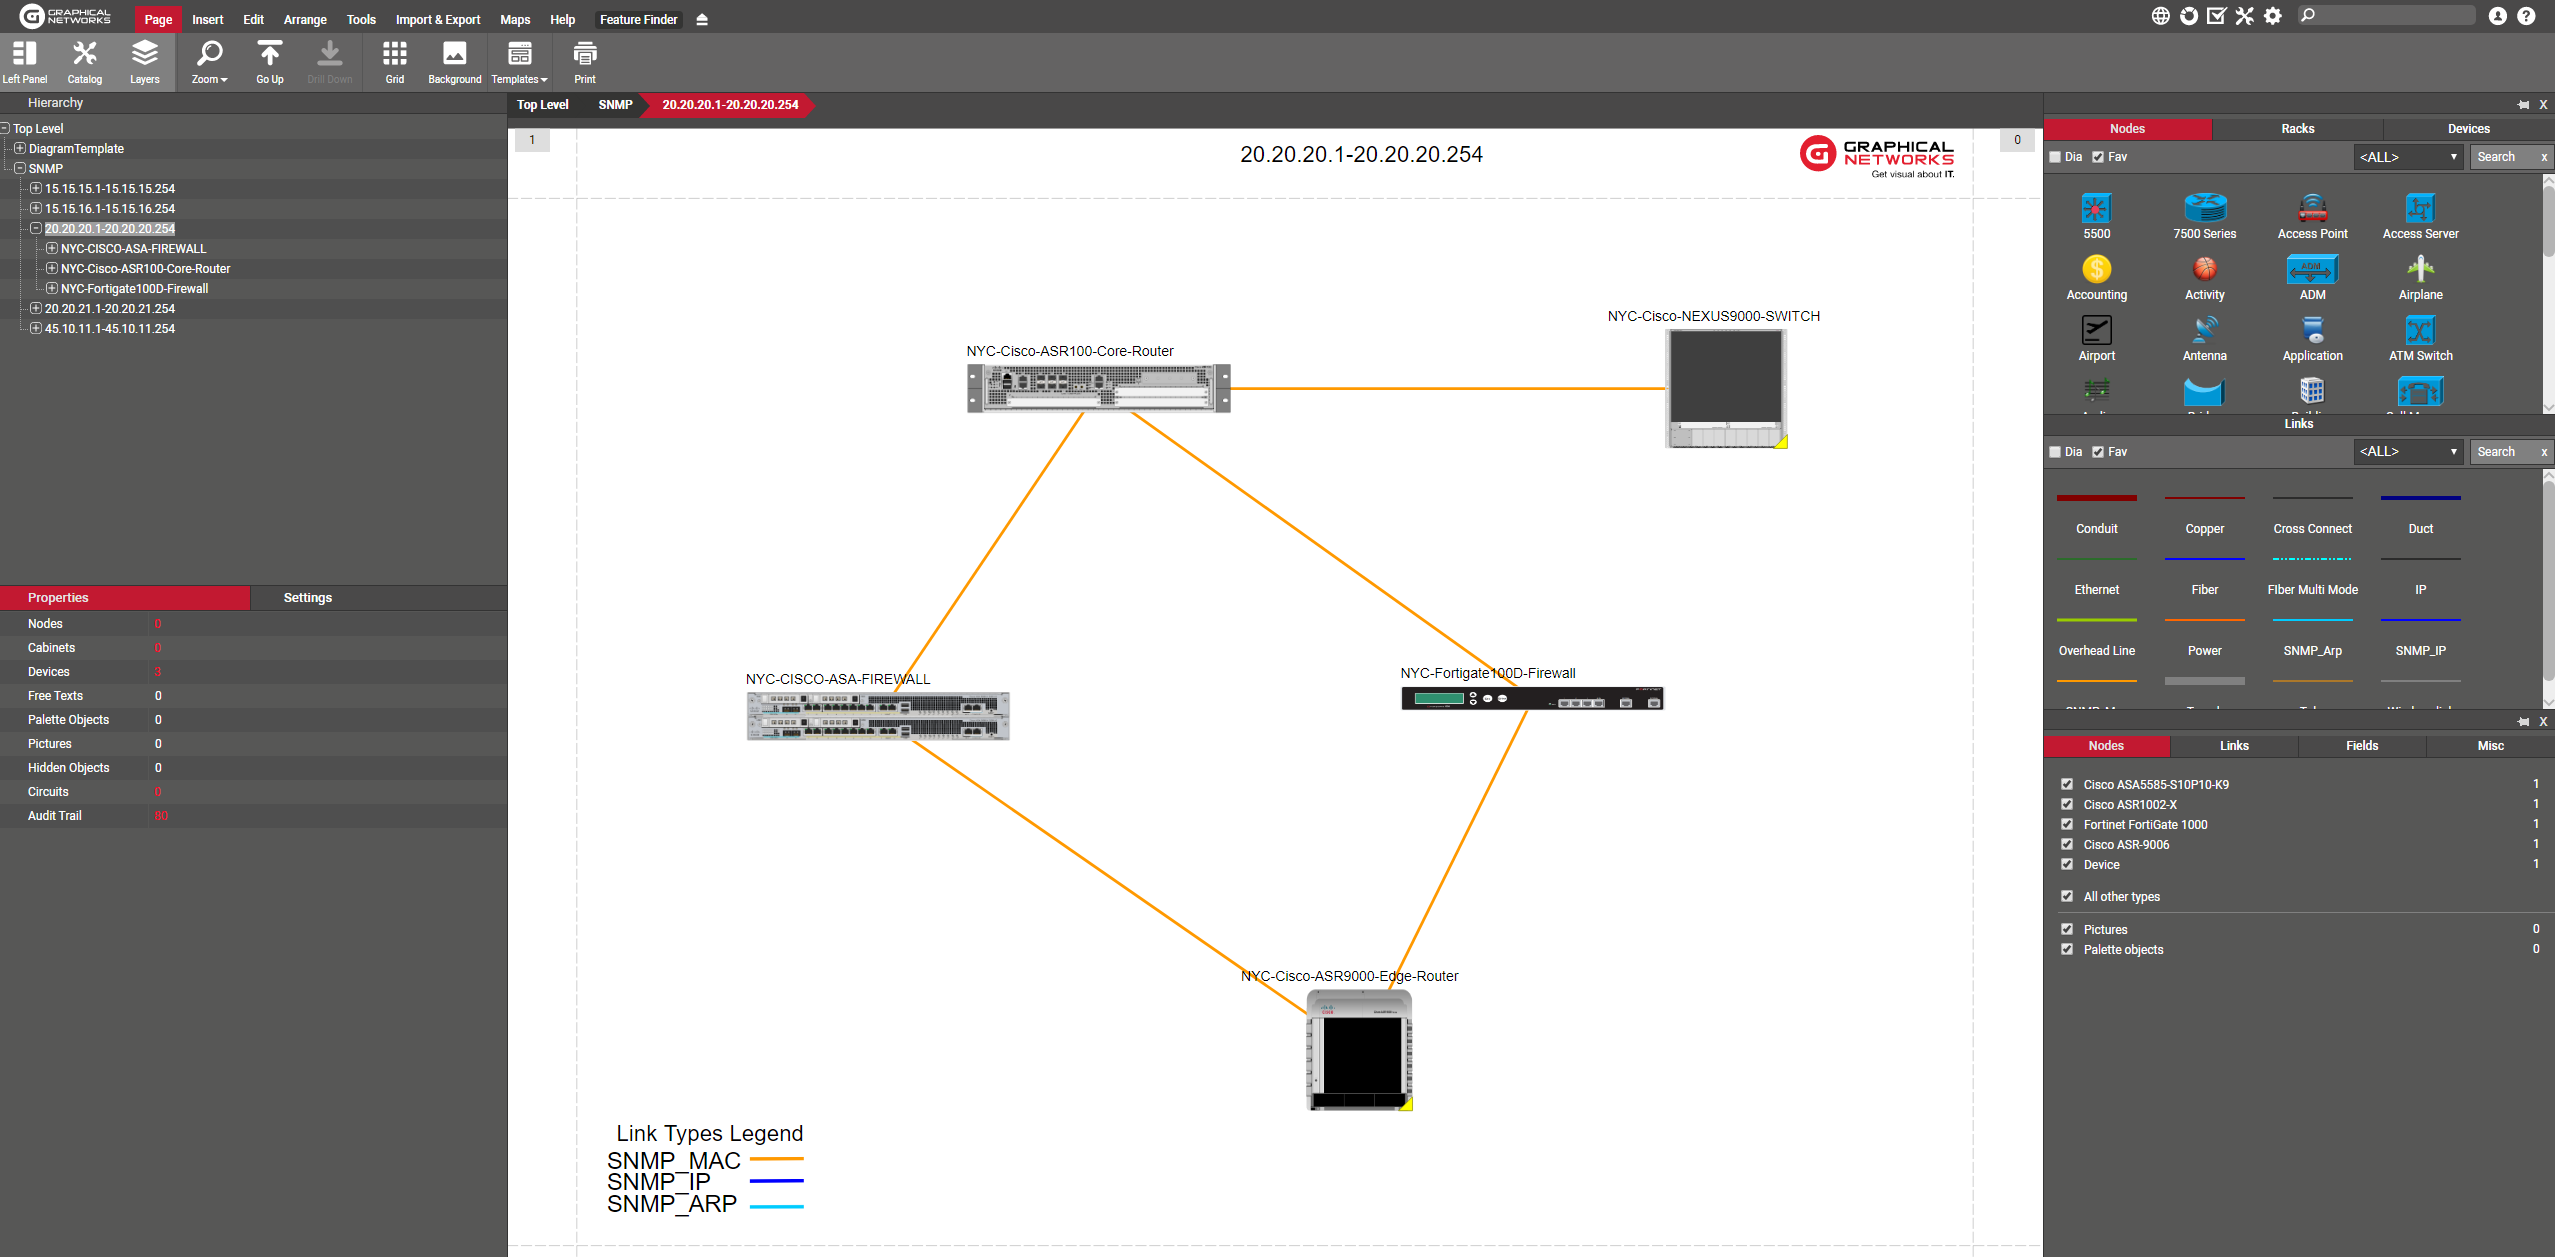 Example of a Physical Network Diagram in netTerrain
netTerrain is a web-based, centralized system, in which users can access a centralized system to view, make comments, and edit the diagrams (with given permissions, of course). You can also assign work order tasks to keep diagrams current.
If you need to have automated diagrams, this can be done too. Included in netTerrain is our Collector/Integration toolkit, where you can use netTerrain SNMP discovery to get up-to-date diagrams and information, with the ability to capture data from third party systems like AWS, Azure, vCenter, CA Spectrum, ServiceNow, and Solarwinds. To learn more about The Collector, click here.
Need reporting? If your management needs to see nice pretty dashboard reports, we’ve got you covered. Need to see asset reports? Check. Data Center Capacity Reports, using netTerrain DCIM (‘DCIM’ stands for data center infrastructure management software), check. Need to get custom reports created for you? Check.
netTerrain can fit your documentation needs: from manually creating diagrams, using network discovery, importing from spreadsheets, and connecting to 3rd party applications. Only the sky, and your imagination, set the limits as to what you can document in netTerrain.