As more and more IT information today resides within virtual environments, there is an increasing need to document this information within a visual repository. Because of this growing need, we are often asked if VMware data can be visualized in netTerrain.
Why…? Here’s what we’ve gleaned from our customers: the main reason to visualize VMware data is to have that (in)famous “single pane of glass” view. Yes, I know: this phrase is becoming way too cliché and pisses off many a reader. But — that pane of glass view truly is a legit reason as to why they are doing it:
In a VMware console or dashboard, you don’t have floorplan, rack elevation, topology or Data Center Infrastructure Management capabilities. Because in netTerrain you can visualize virtual environments, it only makes sense that we have customers using netTerrain for a centralized, consolidated visual IT repository.
Tap into VCenter Systems Using netTerrain
If customers need to access virtual hosts and machines from netTerrain, they won’t exactly be delighted entering in this information manually when it could just as easily be done automatically. In the past, we resolved this with the netTerrain’s Integration Toolkit (ITK). With the ITK, you can tap into the VCenter database to bring in virtual and physical assets automatically (and it’s relatively easy to do this).
We have now introduced a greatly improved mechanism for bringing this info in, thanks to the release of netTerrain’s Collector. We recently unveiled it, which you may have already read about in previous blogs: in a nutshell, the Collector is our next generation discovery engine.
The Collector improves the way in which we can tap into VCenter systems: unlike the ITK, it uses a method that does not require direct access to the VCenter database. In a previous blog, we showcased the ways in which netTerrain’s auto-discovery for DCIM and network documentation have improved with the Collector. To quickly recap that blog: with the Collector you can tap into these data sources in a multi-tenant, distributed fashion and send it back to netTerrain by leveraging our REST API.
So, let’s take a look at how you can discover VCenter environments using the new Collector to populate netTerrain network diagrams:
First, of course, you’ll need to install the Collector. You can do this anywhere — on any machine that has network connectivity or access to your VCenter environment. Since the Collector is a distributed engine and doesn’t require anything special or any back-end database to run, you can choose to simply install it on the same machine where the Vcenter resides.
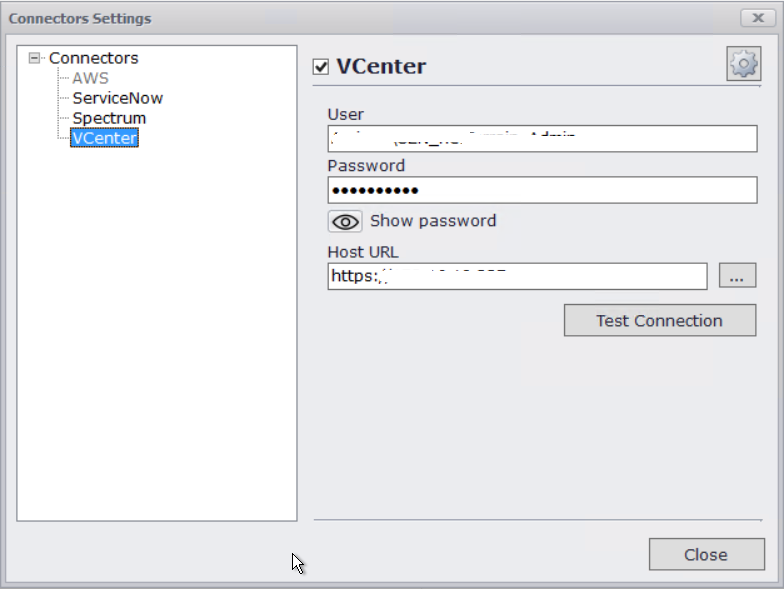
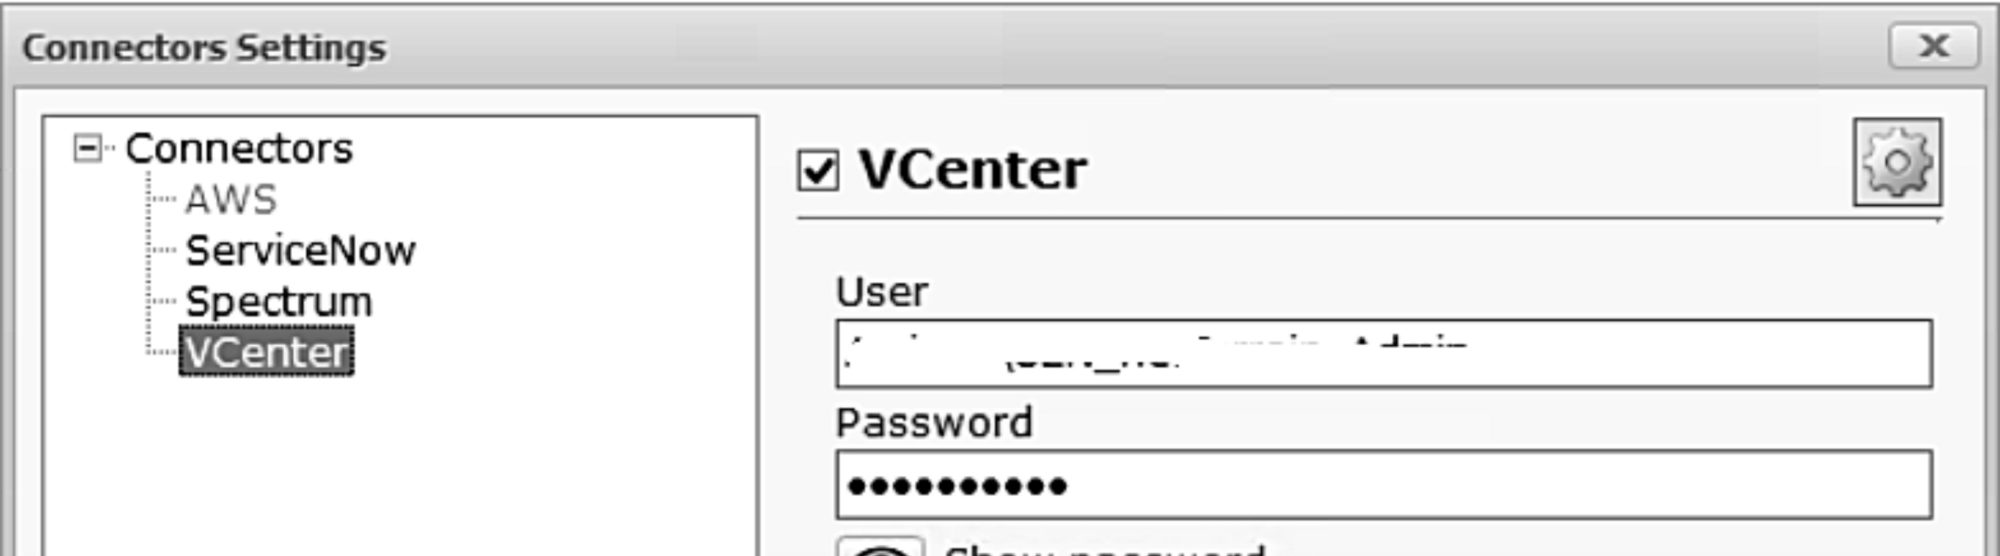
Next, you need to configure the VCenter connector. Because it uses the VCenter API to gather the data, all you need is grab the URL to access the VCenter API and a valid user and password to authenticate.
Run Discovery & Generate VCenter Diagrams in netTerrain
Once you configure the connector, you can run the discovery. The discovery is multi-threaded and can run in different VCenter environments, collecting data about hosts and Virtual Machines and their properties.
You can control which properties you bring in for the hosts and for the the Virtual Machines. Also, as the Collector understands which hosts contain Virtual Machines — for example if a Virtual Machine switches from one host to another — the Collector keeps track of this.
Once the discovery is complete, the discovered data can be pushed into netTerrain. As we discussed in a previous blog about the Collector, pushing data to netTerrain can be done automatically or later on (for example, if discovery was done on an isolated network).
So…what do these diagrams look like in netTerrain? It depends on your preferences and what you need to see, as in netTerrain, you can specify how diagrams are generated in order to fit different types of projects.
You can, for example, depict hosts in rack elevation views for your DCIM projects or you can create topology maps if you’re simply mapping the network.
Use Cases for VCenter Environments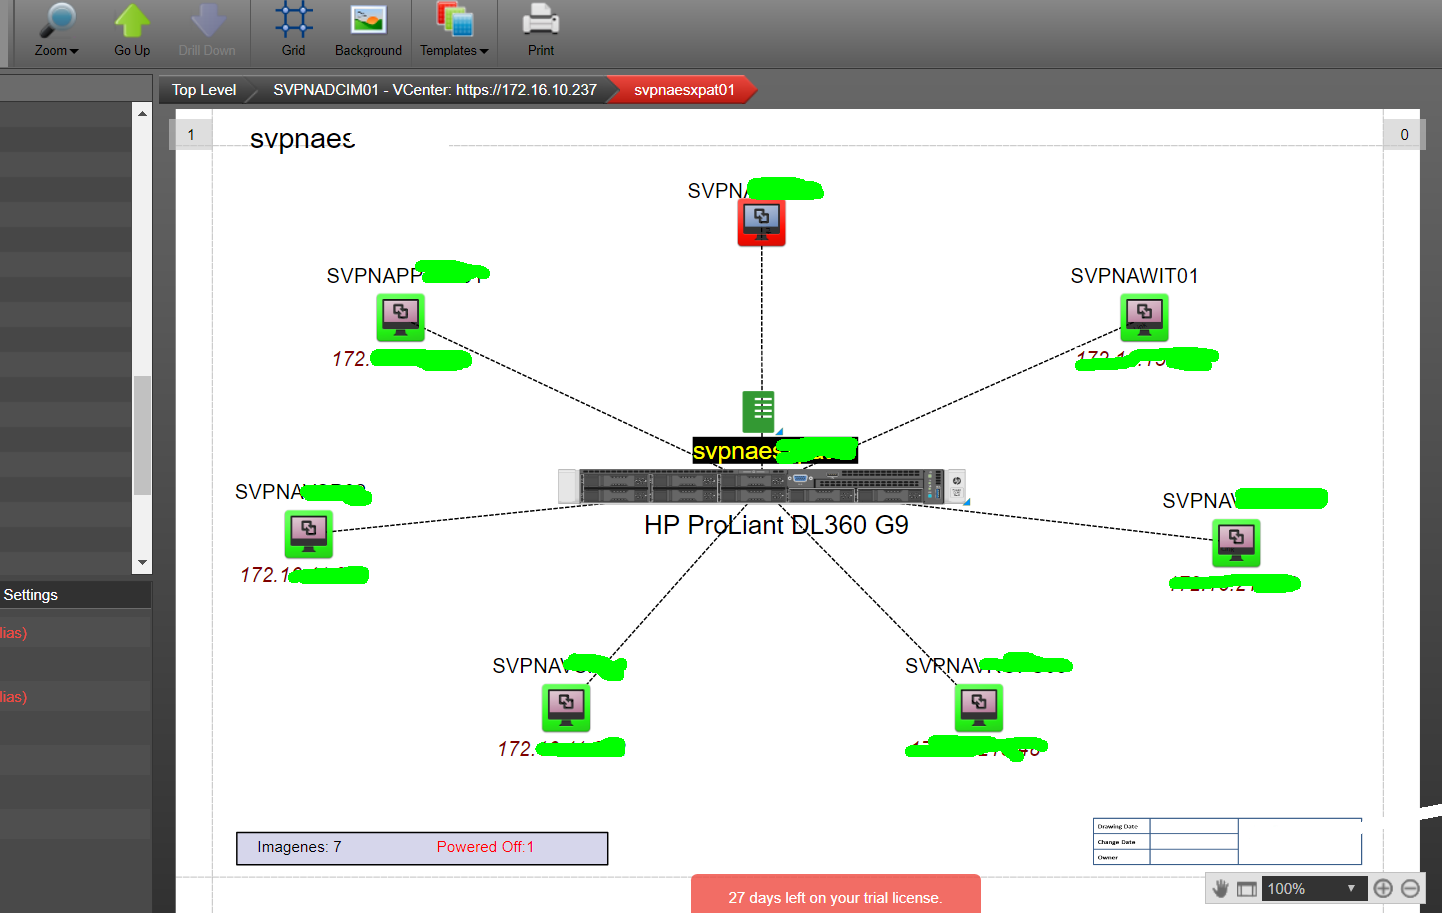
A typical use case for visualizing VMware data in netTerrain would be to create individual diagrams for each host — with the Virtual Machines connected to that host– in the middle of the diagram (just as you can see in the screenshot above).
Another use case we’ve seen with some customers is to reconcile the hosts on racks with the discovered host data — and then to make the Virtual Machines appear as lists for the host on one of its properties (which would launch a table view listing all those Virtual Machines).
Whatever your use case may be, I hope the ideas above can serve as a jumping board for getting your virtual environment automatically populated in netTerrain. If you need that “single pane of glass view” as many of our customers do, you can get it using netTerrain.