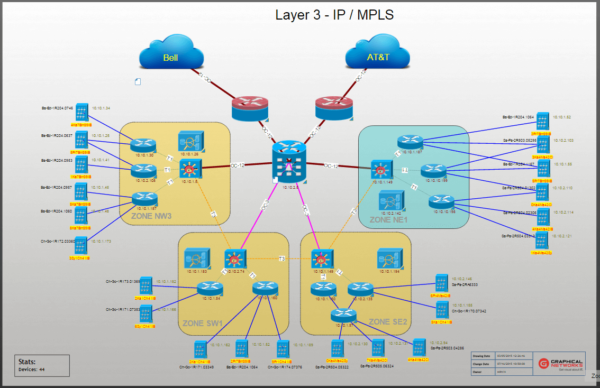
Our IT visualization software netTerrain allows our users to create a wide variety of network diagrams — because of this we get a fair amount of search traffic to our website who want to know what is network diagram software, anyways?
Before we launch into a long-winded and incredibly exciting (yes, I’m being sarcastic) explanation of the history of network diagram software (don’t worry, we’ll skip that), we should first define what is a network diagram, anyways?
We have many posts in this blog that dive into what a network diagram is , so I’ll keep it brief: in short, a network diagram is a visual depiction that shows the various objects (devices, assets, nodes, what have yous) in a network and the connections between them. Network diagrams can be relatively primitive (post-it notes, anyone?) or fairly advanced (physical network diagrams that can go to the port level) —- or somewhere in between post-it notes and diagrams created by advanced IT visualization software (Visio, for example).
Network diagram software is, in essence, any kind of software that can be used to create network diagrams. That leaves the field wide open: some folks use Visio, some use Excel , and even Microsoft Word.
Drawing tools can be used for creating network topology diagrams. When working with drawing software, you simply add icons and lines to depict objects and relationships between them. Microsoft Visio and SmartDraw are examples of drawing tools that can be used to manually create network diagrams.
 Example: Network diagram generated in Visio
Network monitoring tools can be used to create network diagrams, although this is not the #1 purpose of network monitoring and doesn’t guarantee good results. Diagrams from network monitoring software are created as the solution automatically scans the network and generates visual maps based on the scans. Solarwinds is an example of a network monitoring tool that can generate network maps/diagrams.
Generally speaking, however, it’s safe to say that when you hear the specific term, “network diagram software”, it refers to a specialized, or hybrid, kind of software created specifically for the diagramming of IT networks.
Why specialized?
Though network diagrams can be created with Visio, the process to make them, or with any other non-specialized software used for creating diagrams, is manual. Manual processes (when trying to map out an entire network (that is living, breathing, and constantly in a state of flux) lead to major headaches and ineffectual work output.
Specialized tools (such as netTerrain) typically merge diagramming capabilities alongside automatic network discovery. Though your maps may be automatically generated, good network diagram software gives you the ability to customize every detail, such as fields, properties, attributes, images, background images — and to bring in data from 3rd party and/or homegrown tools.
 Example: Network diagram generated in Visio
Bottomline? Network diagram software can be as simple as using Microsoft Paint and throwing some boxes and lines connecting them up there, or as sophisticated as a hybrid solution that combines the detail of a hand-drawing tool with the power of automatic discovery. Shameless plug here: if you’re interested in trying out netTerrain as a possible network diagram software, go ahead and sign up for a demo today.
