Do you have fiber management headaches such as: not knowing how much capacity you’ve got, how much capacity you need, where everything is, or not knowing what you need to take with you to fix an issue? Need a tool that will help you easily document and manage your outside plant? Are you sick of relying on static drawings and spreadsheets like it’s 1999? Thinking complicated and expensive GIS software is your only option?
Good news: there are fiber plant tools out there that make it simple for you to create detailed maps with lat/long coordinates and share them across your organizations.
Many of the organizations with whom I’ve spoken over the past 14 years since my company, Graphical Networks launched our platform netTerrain, have been using various methods of documenting their infrastructures: maps, pieces of paper (seriously!), static drawings, and spreadsheets of connectivity data, and Google Earth diagrams…and they’re ready for a change. If you’re sick of not having the information you need, keep reading.

Which Fiber Optic Details are Usually in Mapping Software Diagrams & Maps?
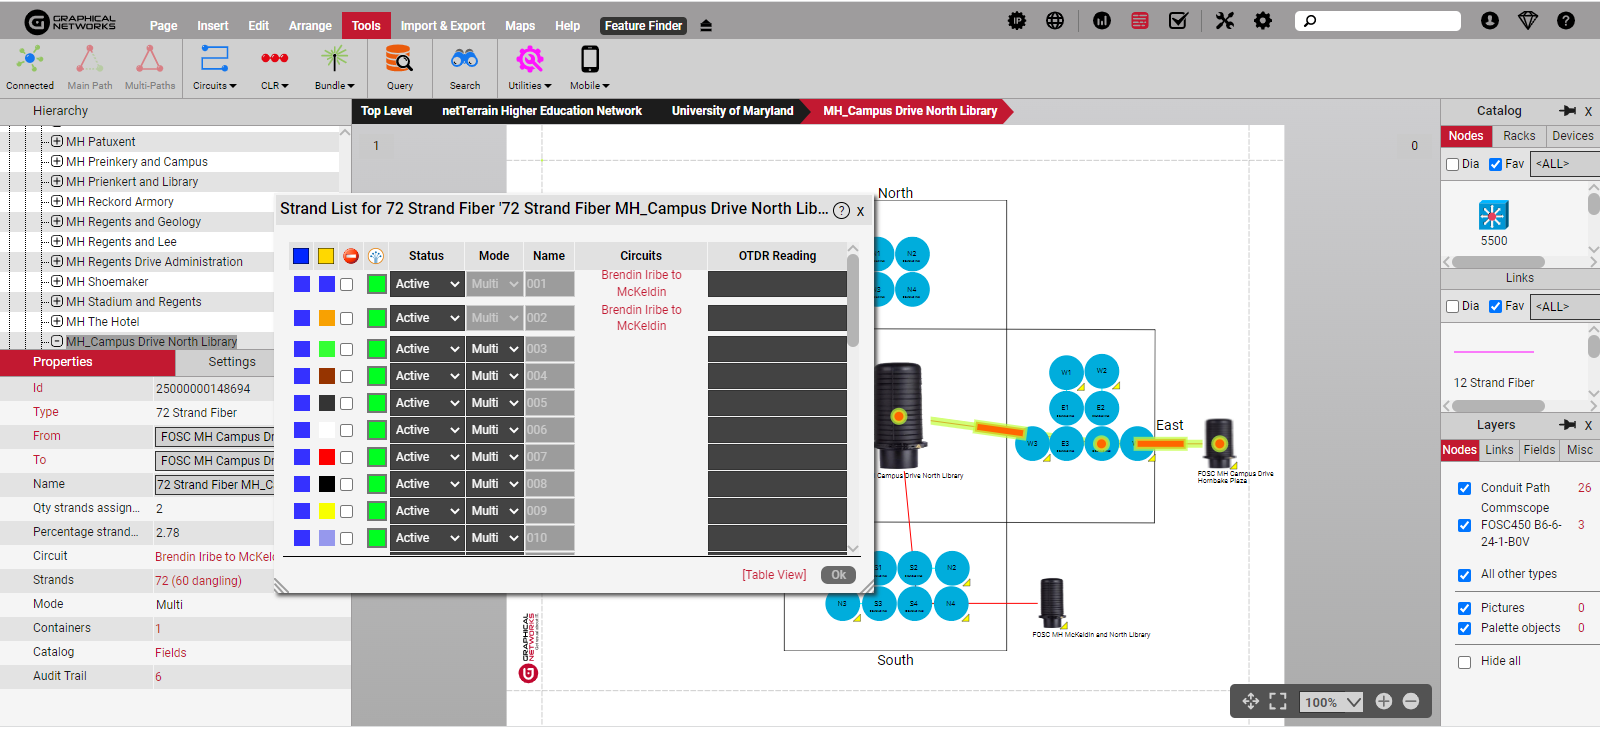
Because fiber managers need to be able to visualize all components of their fiber networks, anywhere from LIU patch panels (even inside buildings (wall jacks, telecom rooms, ducts to floors), splice and fiber enclosures, manholes, poles, and all the conduits down to each individual strand, fiber maps can be incredibly detailed.
To read more about fiber plant maps, click here.
The Problem with Traditional GIS Tools
When they’re designing fiber networks, engineers typically use GIS tools like Google Earth and ESRI to create GIS maps that show where the fiber cables go. These maps have information about each cable, such as location and various properties. However, GIS maps only show a general overview and don’t give detailed information about each fiber splice.
A Better Alternative: Fiber Mapping Software
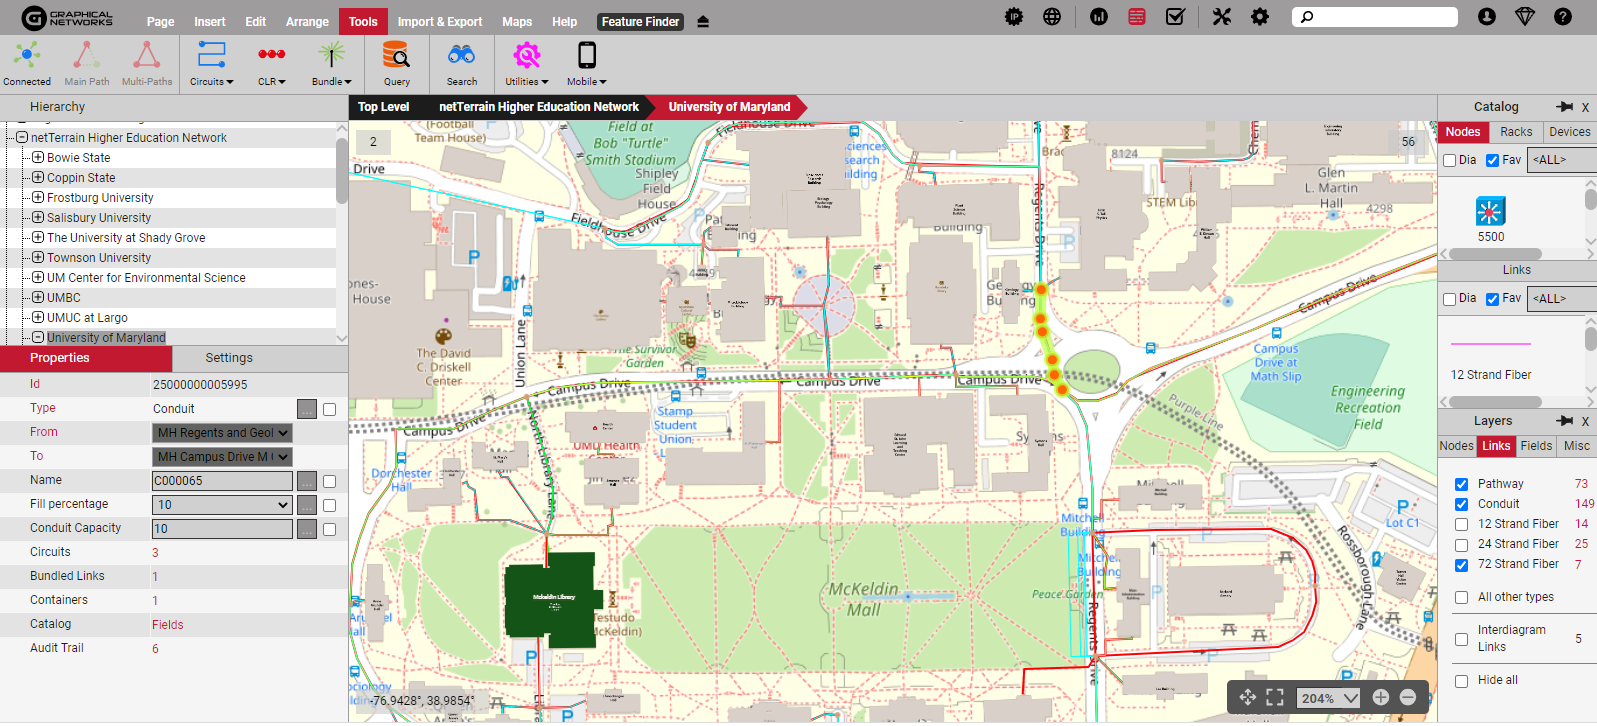
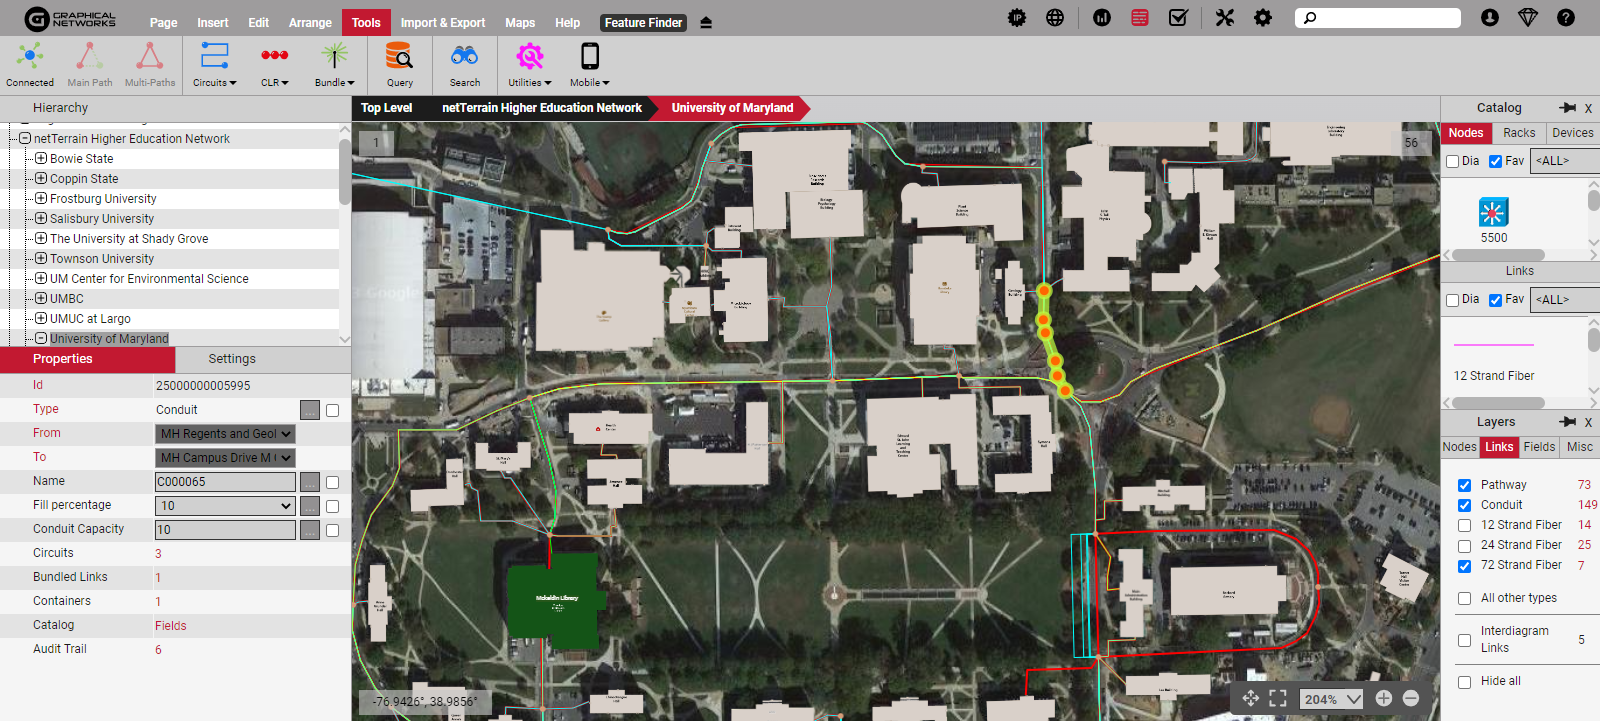
An OSP platform, aka fiber mapping software, helps engineers create and manage fiber optic, fiber cables, and wireless networks on GIS maps like OpenStreetMap or Google Maps satellite. In addition to powerful visualization, it also has extra features that help organizations manage capacity and plan for future growth.
With an OSP solution in place, engineers can run queries on the data they’ve collected, which can help them make decisions about their infrastructure. For example, they can get geographic information, determine which areas of the network are close to reaching capacity, and plan to upgrade those areas before they become overloaded. This can help prevent network outages and keep everything running smoothly.
With a mapping platform like netTerrain, it’s easy to:
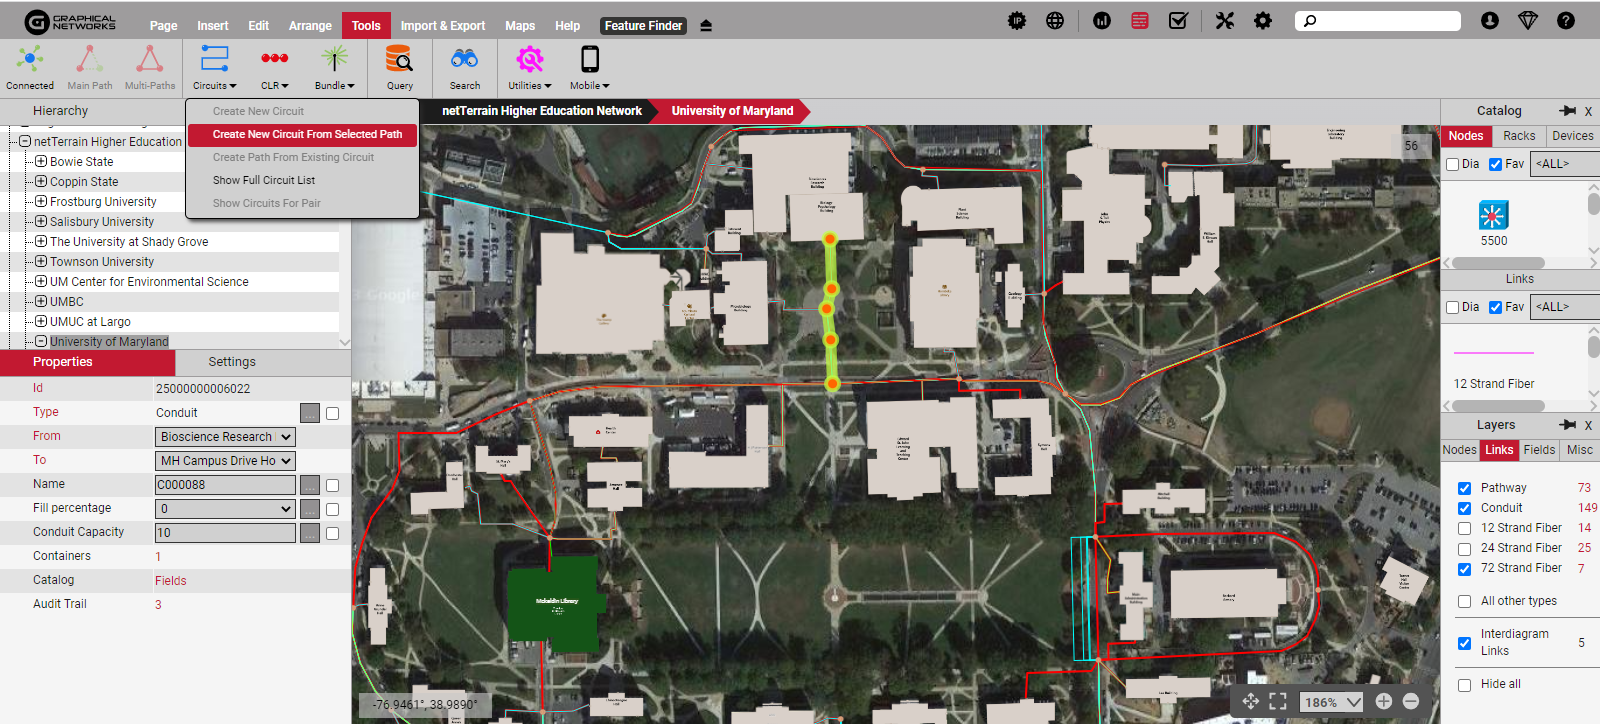
- Create new circuits using existing fiber infrastructure: Instead of adding new cables, an OSP system can help you identify available paths between buildings using your existing infrastructure. Click here to learn more.
- Generate a Bill of Materials report: When you provision a new circuit, your OSP tool can automatically create a Bill of Materials report that you can share with cable installers.
- Use Work Order to manage changes: Software like netTerrain OSP makes it easy to use work orders Whether you use ServiceNow, Remedy, or the OSP software’s built-in work order tasks, you can use this feature to make updates to the network more efficiently.
- Gain a comprehensive view of your fiber infrastructure: With an OSP solution, managing your fiber infrastructure goes beyond just seeing a geographic map. It lets you see all your components in an easy-to-understand way, so you can make informed decisions about the network’s management.
If a business needs to keep track of their fiber network, OSP tools are a great choice (for example, many of our users once had OSPInsight deployed). They help with decision-making, managing capacity and growth, and troubleshooting. An OSP solution like netTerrain goes far beyond just showing a map of the network’s geography.
Are you ready to take the next step and try out software like netTerrain OSP for free? Click here to get a demo and free trial.