 As a software vendor specializing in IT documentation, we get a decent amount of website visitors who find our site while searching for specific explanations of what, exactly, network diagrams are…so we figured: why not write about them in-depth…
Learn the in’s and out’s of network diagrams: what they are, how they’re used, how to make them, and the different types that are employed in IT:
- what network diagrams are,
- why they’re needed,
- the different types of diagrams,
- how you can create them,
- and how/why they’re used.
What is a Network Diagram?
A diagram is a visual chart for network assets, connections, and paths. Because there are myriad interdependencies in any given network, these diagrams are used to display, visually through the use of graphics, the various dependencies and interdependencies in a network.
They can be drawn by hand, or automatically generated, using software, via network discovery.
What Are the Components of a Network Diagram?
Different shapes are used to represent the different components of the network. The level of detail depends upon what you use: shapes can be very simple – as in triangles or squares – or they can resemble actual devices in the network.
Nodes are used to represent anything in the network: assets and tasks. Lines in a diagram represent any connections or dependencies.
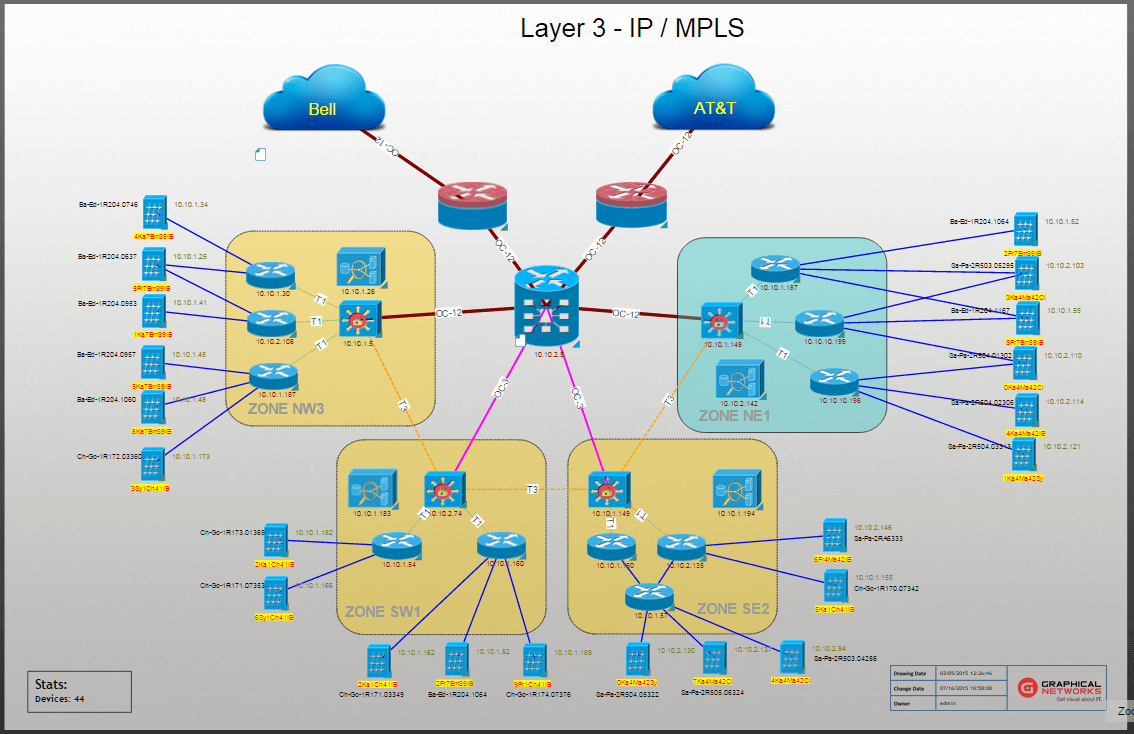
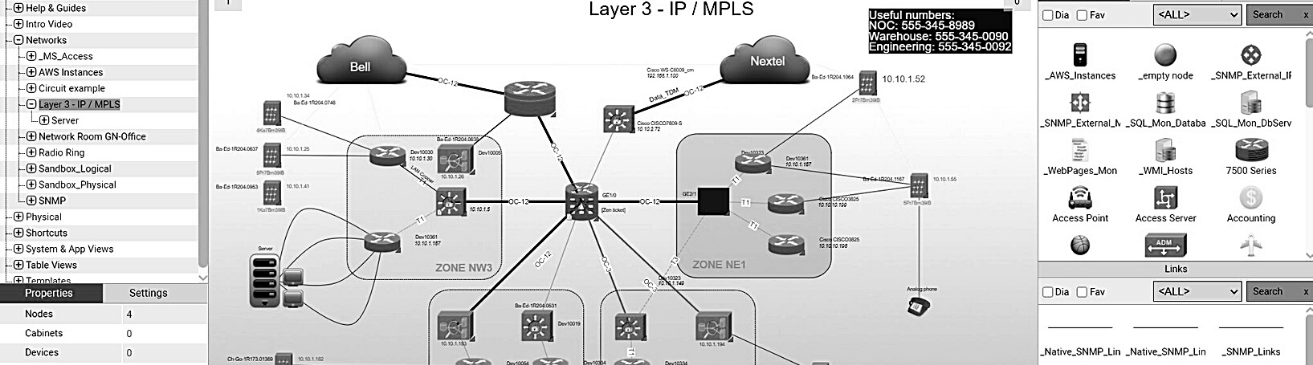
Example of a Logical Diagram in netTerrain
Common shapes/symbols which you may find include:
- Clouds
(Clouds are often used in diagrams to represent top levels – where details are not crucial) - Workstations
- Servers
- Mainframes
- Devices that facilitate connections, such as routers and switches
- Odds & ends (such as printers that are on the peripheral of the network)
Physical Diagram vs. Logical Diagram?
A physical diagram shows the physical topology of how devices in a network are connected. A logical diagram shows how information is actually flowing through the network: these diagrams show subnets (masks, addresses, VLAN IDs), routing protocols, and network assets such as routers.
How are Network Diagrams Rendered?
They can be rendered in a number of ways: diagrams will look differently depending upon how the network they represent is physically arranged. The way a network is arranged is called network topology. Topology means how nodes, or devices, are arranged in a network. While LANS will typically have one of the three main network topologies, larger networks may have multiple different arrangements.
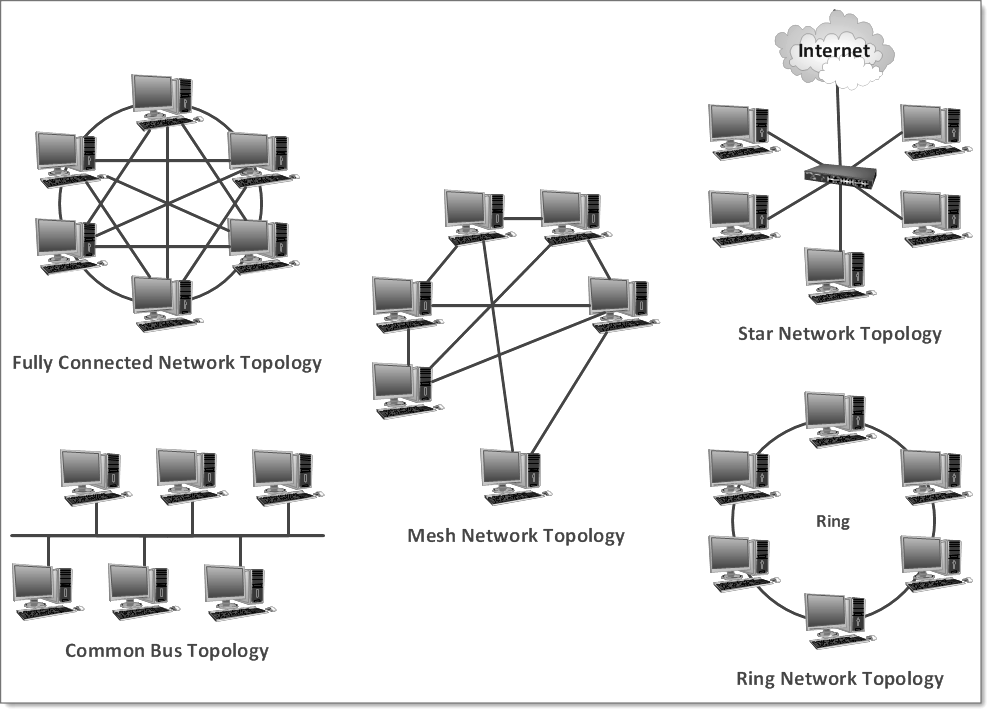
Diagram Examples of Common Network Topologies
The following are the three most common topologies that you will likely see reflected:
Bus Network Topology
This is the most simple topology: everything in the network (workstations, servers, printers) are connected by one cable. The big problem with this kind of topology is that, while it’s very affordable, it leaves the entire network vulnerable to downtime — and without any easy information about what caused an outage in the first place.
Ring Network Topology
In a ring network topology, you have the various devices connected to other devices in the form of a ring. The benefit of this setup is that you don’t need terminators at the end, as you do with the linear topology — and this kind of setup can run faster. The downside is that the network is still vulnerable to outages and downtime, without easy answers when troubleshooting.
Star Network Topology
In a star network topology, there is a central hub which connects to network devices. The benefit of this setup is that it tolerates faults far better than a ring or linear/bus topology — it’s best suited for larger networks.
Why is a Network Diagram Necessary?
Simply put, they provide the network’s administrators (engineers) a visual map with which they can understand how the network is set up.
With this map, admins can identify where an issue has arisen, locate network assets and IT equipment, and track changes to the network. When admins have these abilities, they can troubleshoot issues quickly, reduce IT waste — and save time and staff resources.
How & Where are Network Diagrams Used?
Diagrams are meant to be used by anyone and any organization with a need to document their IT stuff. In general, the larger the network — the greater the need to diagram and map it.
If you have a network, and it doesn’t fit in a shoebox, you probably want to use some diagrams to document your IT stuff.
How Do You Create Network Diagrams?
You can create diagrams many different ways: by hand with just a pen and paper marker board — or you can use Visio or Excel. You can also use a specialized documentation tool.
The method you choose for creating your diagrams will depend upon how much detail you need, how large the network is, and, of course, what your budget looks like (if there is a budget for documenting the network).
If you aren’t using an automated diagramming solution to discover the network, you’ll want to start with paper and a pen first. Write, or draw, out what it is you need to document/diagram. Make a list of what you need to include: servers, printers and other peripheral devices, routers, switches, and so on. Label everything: don’t assume that someone else looking at your diagram will know what an object on the diagram represents. Make your connections by drawing lines to reflect what’s connected to what. Use different colors for lines that represent connections, and different colors depending upon which assets you are documenting.
Example of a Network Diagram Created Using Visio
What is Network Diagramming Software?
Diagram software — aka network documentation software — helps organizations with larger networks get more documentation done, with greater detail, in less time.
Diagramming software allows you to automatically generate, or just drag-and-drop, ready-made icons to represent your different devices and network components onto a template or your own background. By eliminating the manual data entry, automated IT documentation and diagramming software helps organizations ensure their diagrams are up-to-date, accurate, and done.
While features in software vary across vendors, some notable features include: inventory management, automatic network discovery, diagram templates, and circuit/cable traces.
Graphical Networks offers diagramming software –, but we’re not the only ones. Wikipedia offers a comparison list of various software vendors online.
Best Practices for Creating Network Diagrams
When it comes to diagramming and documenting the network, the number one rule to follow is this: keep doing it. There’s little-to-no point in creating some diagrams one time and then abandoning them. The network is alive and it’s constantly changing: in order for diagrams to help you, they need to be accurate and reflect changes to the network.