I must admit that I am amazed by the amount of ServiceNow implementation in the corporate world today. With the proliferation of ServiceNow we get quite a few requests from customers to integrate some of the data they have in ServiceNow with their netTerrain projects.
As I am no ServiceNow expert, I can’t tell you exactly what type of information is stored in there. I do know, however, that some of that information is useful in data center infrastructure management related projects, outside plant and fiber plant implementation and in network mapping diagrams.
Here’s a real-life example: we have a customer that generates fiber circuits automatically by having ServiceNow push the data programmatically into netTerrain using our API. The process is quite clever as an external application, which uses our API, supplies netTerrain with the fiber circuit end points as well as any additional circuit properties.
This particular use-case is quite sophisticated because it required the creation of a REST API client. You may not need to go to these lengths if you only had some predefined mechanism to push a set of basic data from ServiceNow into netTerrain…
Enter the new netTerrain Collector. As we saw from the previous blog about visualizing VCenter data, the Collector includes predefined connectors to commercial off-the-shelf systems such as ServiceNow.
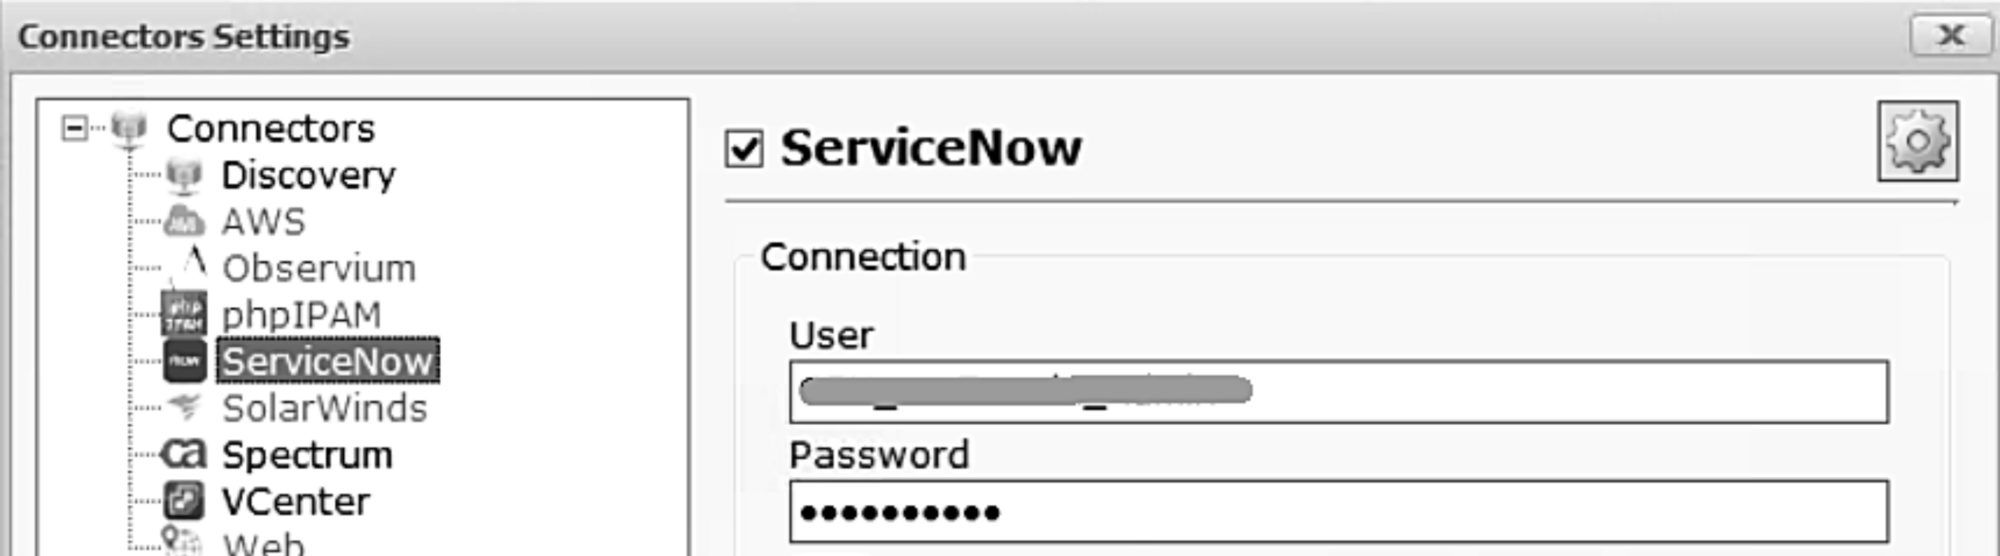
The Collector’s connector for ServiceNow includes some text files which contain metadata associated with the properties that you need ported over to netTerrain. Just as we saw in the VCenter data visualization blog, this process starts with the simple act of pointing to the ServiceNow API server URL, as well as providing a username and password.

Once you’ve configured the connector, you next run the discovery. The discovery is multi-threaded and can run in different ServiceNow environments, collecting data about assets and the properties (which you have configured in the connector). All the ServiceNow device related data and storage are then kept in a JSON file.
This file is stored locally on the machine where the Collector resides. You can choose to send this data to netTerrain automatically (or at a later stage if discovery was performed in an isolated environment).
You may want to massage this data before sending it to netTerrain if, for example, you simply want to update properties for existing devices rather than create all new devices directly off of the ServiceNow data.
The Collector can run scheduled discoveries against ServiceNow and keep these properties up-to-date in netTerrain with any frequency the user desires (in the tool’s ‘steady-state’ mode).
As ServiceNow is not usually an asset management repository, we often see customers who want to just bring properties in to update existing devices already in netTerrain (such as a ticket number).
What do the resulting diagrams in netTerrain look like?
As with other connectors, it all depends on what you need as, in netTerrain, you can fine-tune your diagrams to fit specific types of projects.
You can depict hosts in rack elevation views for your DCIM projects or you can create network topology maps if you’re simply mapping the IT network.
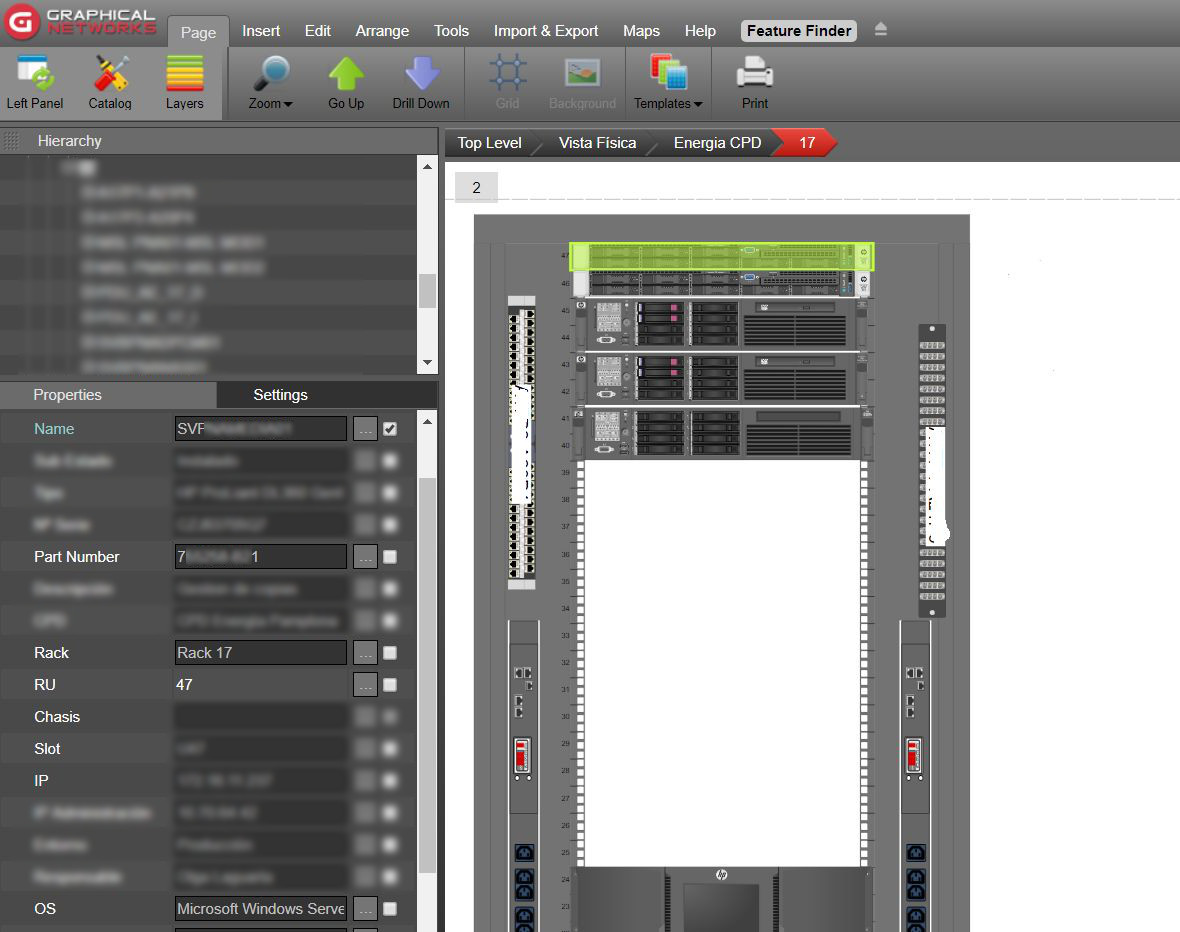
A typical use-case would be generating rack diagrams for each asset and populating them with specific properties from ServiceNow, as you can see in the image above.
You can also generate the same type of information on application or logical network diagram views. Even fiber plant data which may reside in ServiceNow can be populated in netTerrain.
Whatever your use-case may be, the key here is automation: don’t enter information twice if you already have a single source of truth. If, for at least for part of the network, this single source is in ServiceNow, just have the Collector do the work for you. You’ll end up working less and get up-to-date and precise information without the risk of manually populating incorrect information.