I remember way back in my Concord (and later when I worked for CA) days: I took a liking to the recently acquired Spectrum network discovery software (this was probably around 2004 or 2005).
Spectrum was one of the first tools that I remember was capable of bringing in link data from an SNMP discovery process — and it also did some interesting things around alarm filtering and root cause analysis for network troubleshooting purposes.
Because of functions such as these, it’s no wonder that many of our customers had already adopted CA Spectrum. On the surface it may seem like having both systems is a bit redundant. If you have netTerrain, which also has discovery, including layer 2, then why Spectrum?
Spectrum goes beyond discovery and basic alarming and provides the whole gamut of alarm correlation and suppression for the entire system chain. Users of Spectrum may also *claim* that it has topology views…so why netTerrain?
If you are a current user of netTerrain, you probably know the answer to this already. While Spectrum provides some very rudimentary network topology views, netTerrain offers a whole array of network mapping and IT visualization features, provides DCIM-ready rack and cable management, environmental monitoring, as well as outside and fiber plant GIS-based mapping capabilities.
So now that many customers have both tools it only makes sense that they would want to integrate them. Just as we covered in previous blogs regarding the visualization of ServiceNow, VCenter, Solarwinds and other third-party tools, in the past we would have integrated using some sort of database or text based import mechanism. The case of Spectrum is actually an interesting one, because until fairly recently, the way to integrate with it was to read the configuration data via their CORBA API.
Yes, you read that right: CORBA. Yuck. So in the past when we only had the Integration Toolkit we had to either use that or some Spectrum scheduled text export mechanism and read from those files. Not pretty.
Thankfully both the team here at Graphical Networks and Spectrum upped our respective games: we introduced the Collector and its API-based connectors and Spectrum finally embraced the 21st century with a proper REST API.
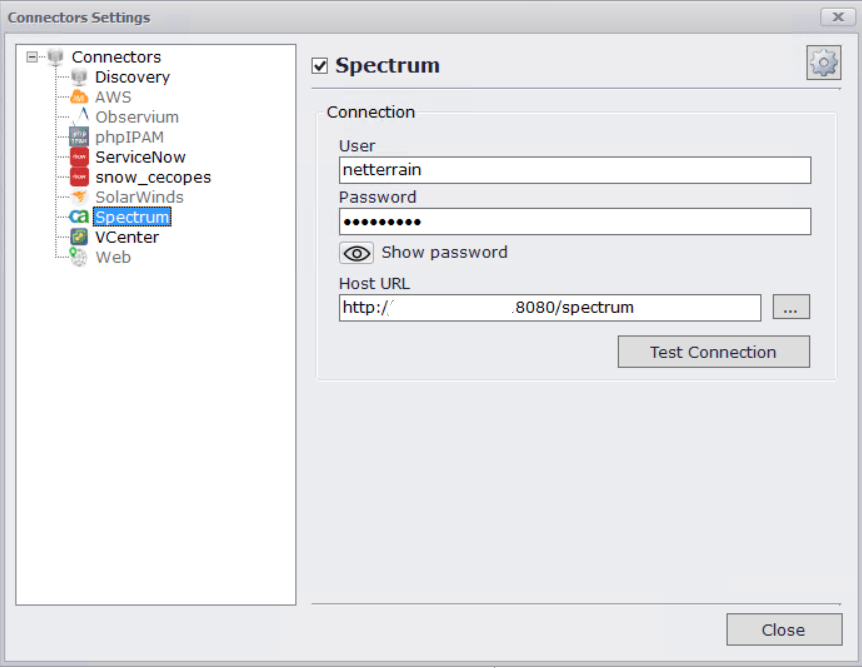
As we learned in previous blogs, each connector includes some text files that contain metadata associated with the properties that should be ported over to netTerrain with the process starting by pointing to the Spectrum API server URL, including username and password.
Once you configure the Spectrum connector you will then need to run the discovery.
The discovery is multi-threaded and can run in more than one Spectrum environment collecting data about devices and the properties configured for that connector. After each discovery, the Spectrum data is stored in a JSON file.
Just as with the other connectors, these JSON files are stored locally on the Collector machine. The Collector machine, by the way, can be any computer that has hardware and software requirements equivalent to what was found during, say, the first Obama administration.
JSON files can be inspected or parsed locally but are usually just flat data sent to netterrain automatically or at a later stage if discovery was executed on an isolated environment.
In steady state mode, the Collector can run discoveries on a scheduled basis against Spectrum and keep the properties up-to-date in netTerrain. The frequency at which this is done can also be configured through the Collector’s settings.
Whether the end goal for this integration is to bring in newly discovered devices into netTerrain or just update properties for existing ones that match up with Spectrum, you will have one or more IT diagrams in netTerrain that contain assets or devices. This can be a logical or physical diagram of one or more networks or maybe a series of rack elevation views with devices reconciled with Spectrum. This means that you can use these Spectrum integrations (yes, you can have more than one feeding into one netTerrain project) to improve your netTerrain logical documentation or to use in conjunction with your Data Center Infrastructure management views. We have customers that integrated CA Spectrum for both views combined as well: a logical network topology diagram showing, for example, core devices, which are linked to the physical DCIM system rack elevation and cabling views.
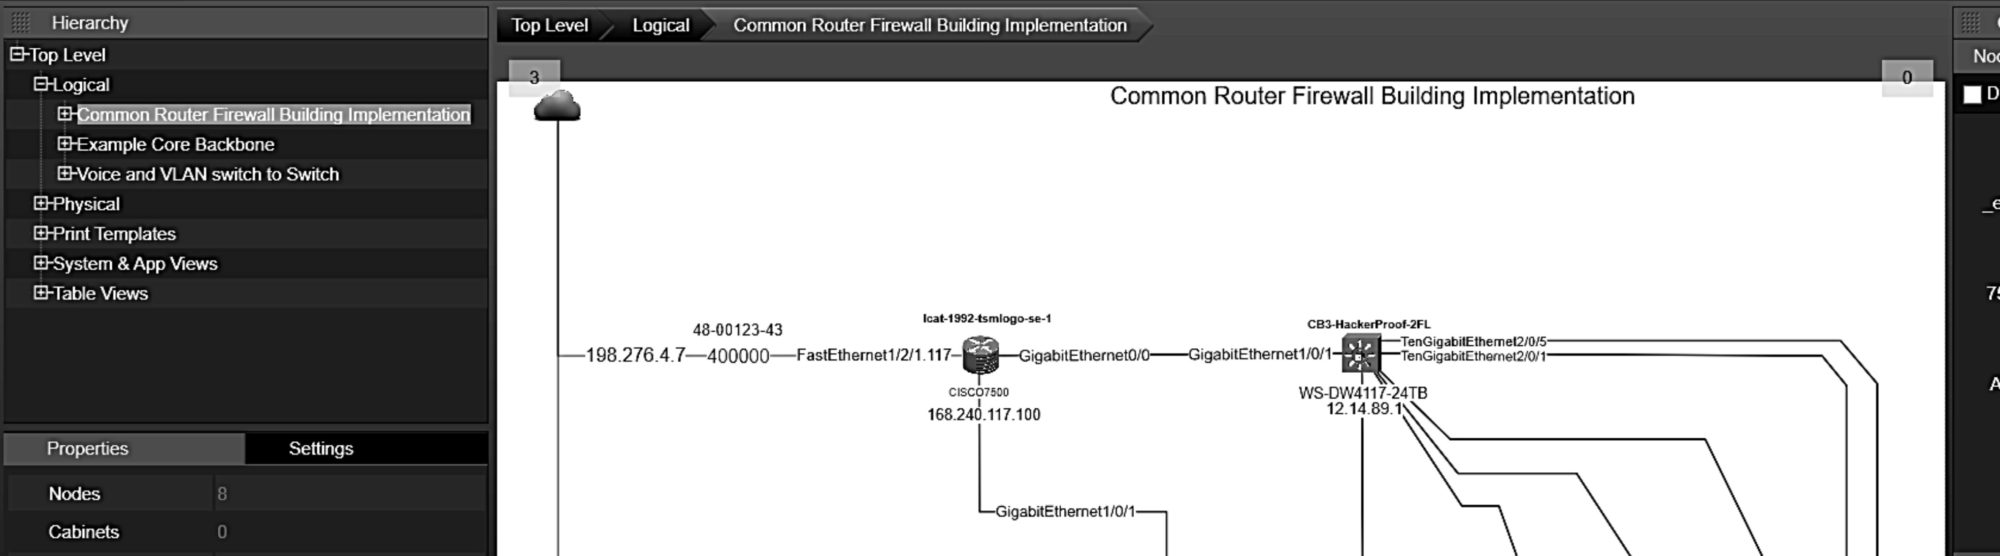
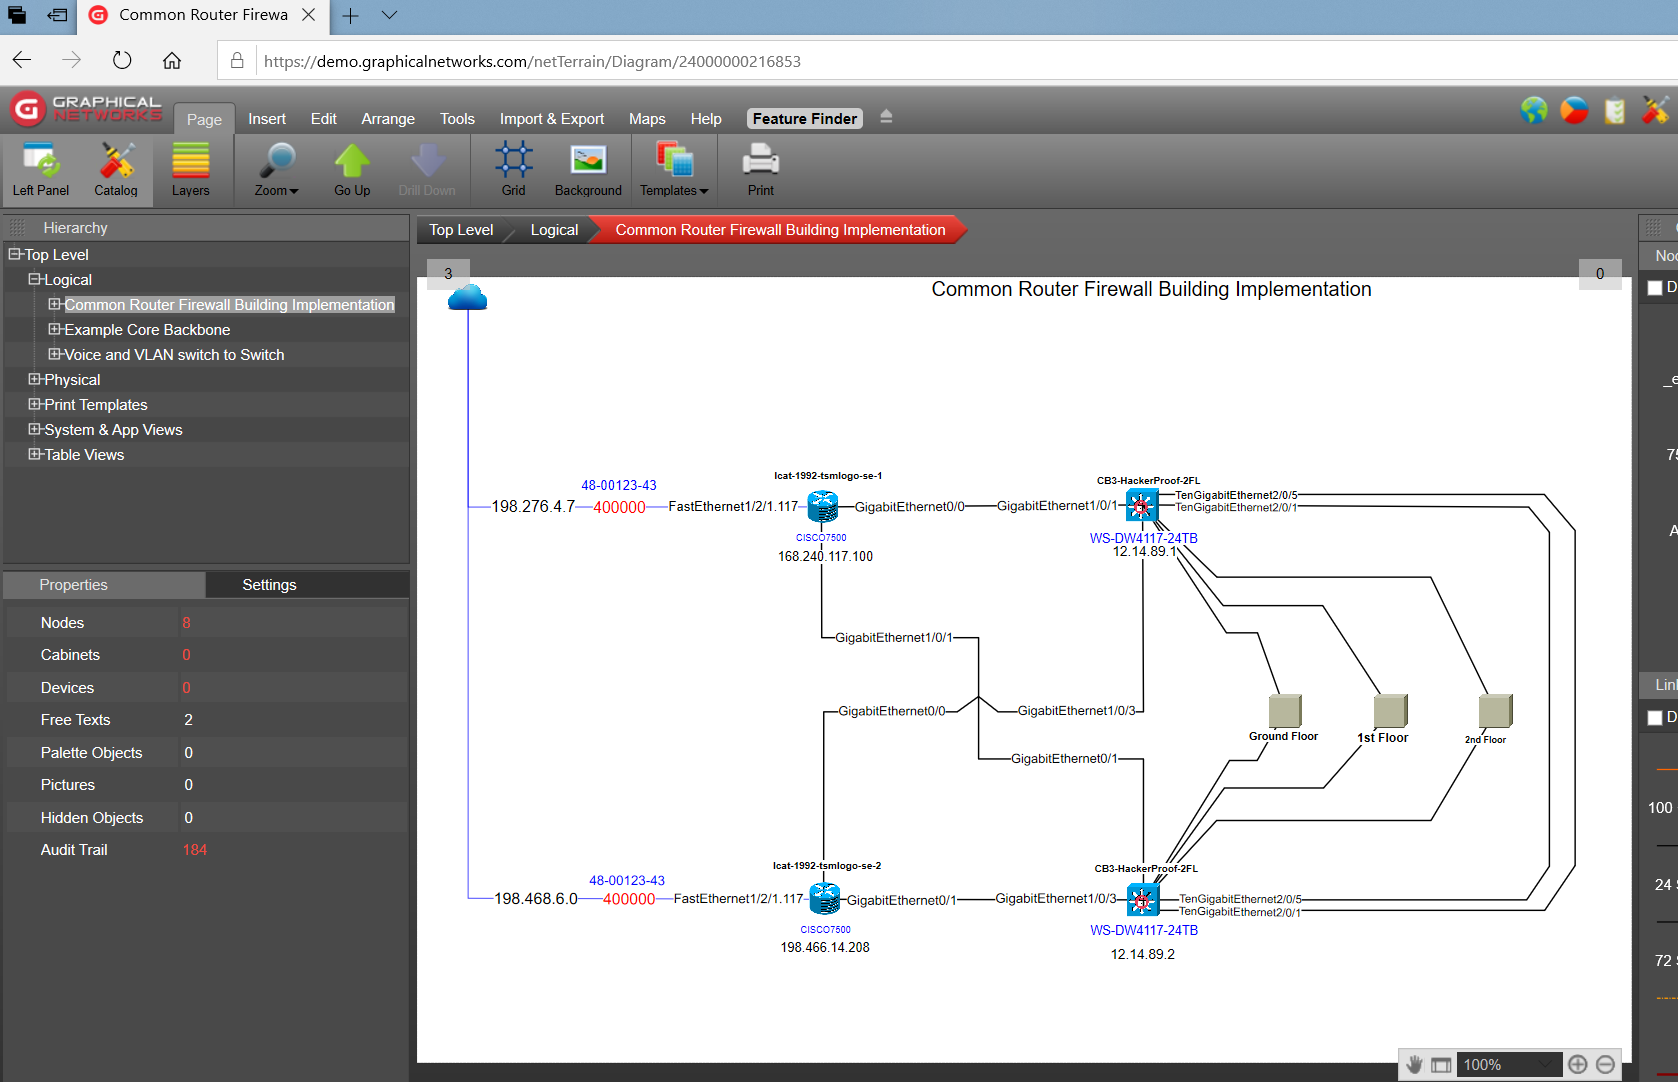
A logical network diagram could be something like this:
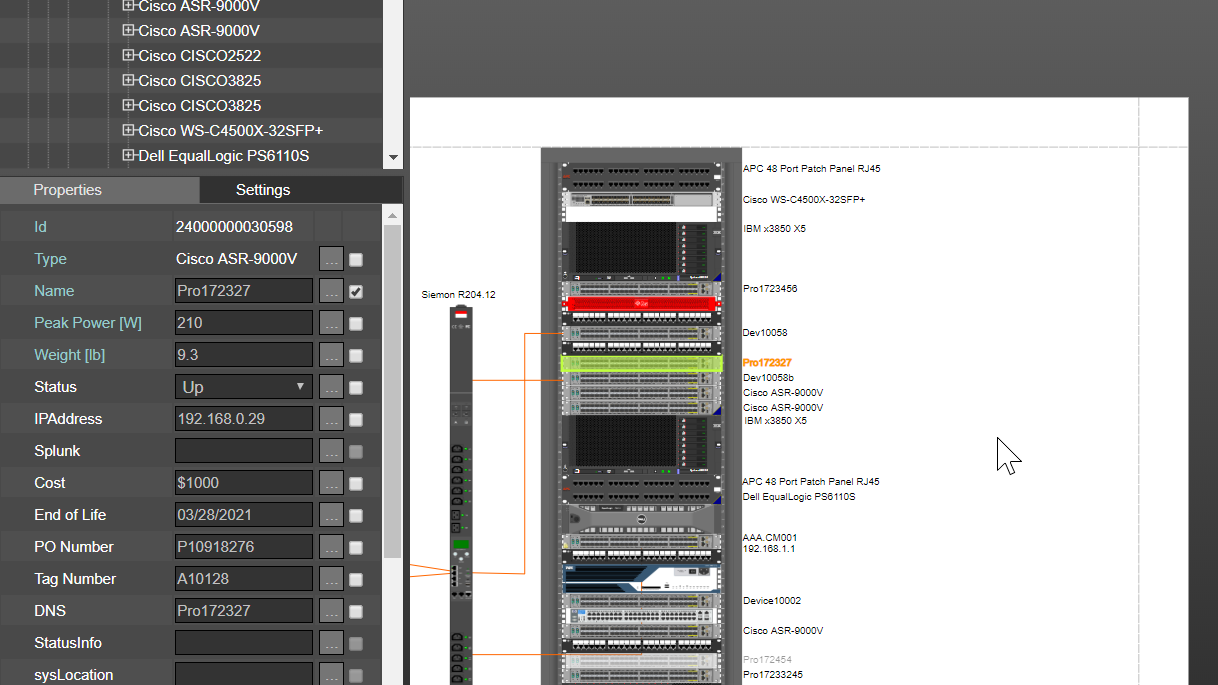
A physical view of the rack mounted device in netTerrain showing Spectrum-discovered data could be something like the following:
The overall message is always the same: automate whenever you can.
Don’t enter information in two places if you have a single source of truth. If CA Spectrum is this source, have the Collector (with its Spectrum connector) do the work for you and leverage your Spectrum investment. You’ll also end up working less and lower the risk of inputting incorrect data into your DCIM tool or your network.