In this blog, I want to discuss our recently released product, netTerrain Outside Plant and, particularly, how it compares to other products out there in terms of both features and pricing.
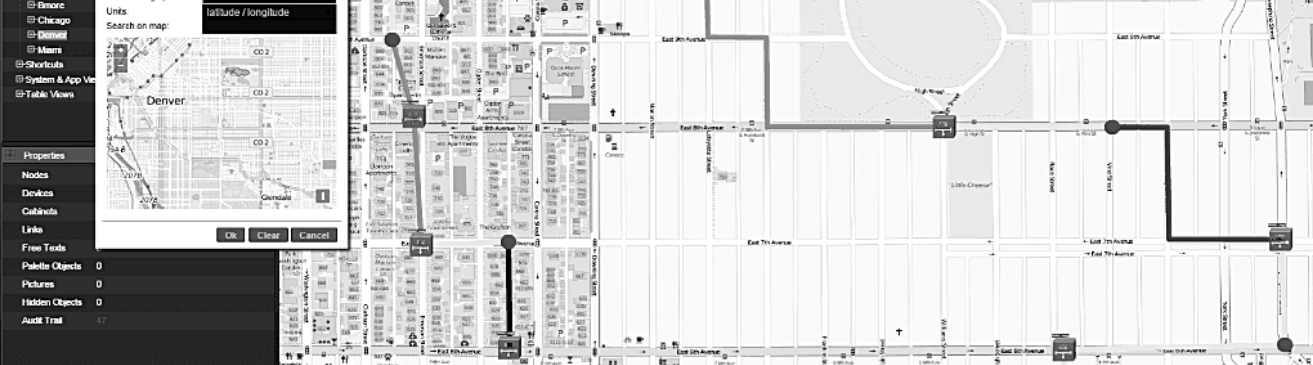
netTerrain OSP helps you visually manage your fiber, copper, transmission and wireless networks; you can take control of your outside plant connectivity with dynamic maps that let you zoom down from world-view to the street level. So, if you need a tool to assist in graphically managing your fiber network on GIS maps, your outside plant objects, or any network of assets requiring geo-referenced maps, you can now do that with netTerrain OSP.
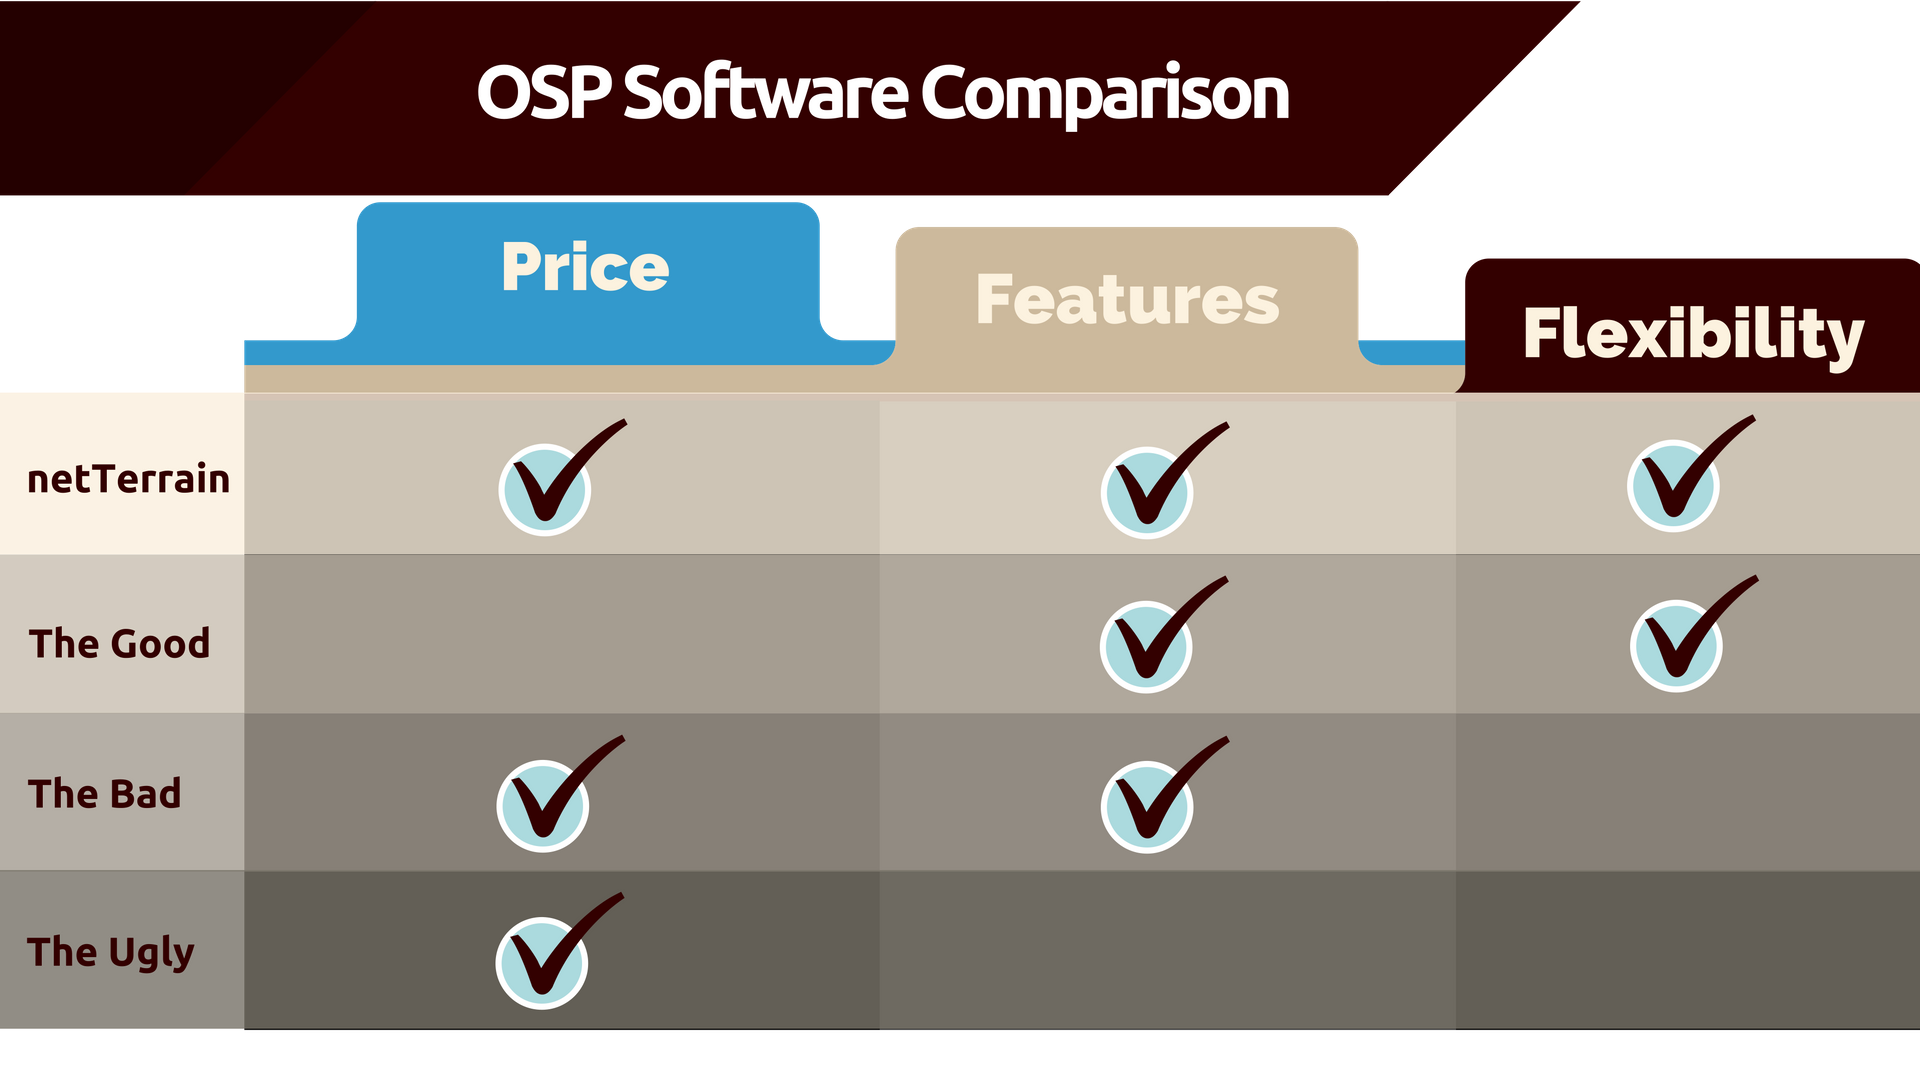
The Good, the Bad & the Ugly
One could probably make the case that the fiber optic network documentation market is overcrowded….that is, until you start looking under the hood. Believe it or not, the options on the market are fairly limited. How else, then, could we explain why so many of our netTerrain customers asked us to come up with a good solution?
Before netTerrain OSP hit the market, you could find three types of tools for fiber optic network documentation:
The (Unaffordably) Good
Ah, the good tools – and the most expensive ones. Of course, there are tools out there that offer the goods – but they are simply way too expensive. You get the features, and (hopefully) the usability you need – but expect a high 6 figure or 7 figure price tag. Some of these tools are part of a larger inventory or provisioning OSS – but if you are responsible for just the fiber base piece, you’ll still end up shelling out the big bucks – even without some of the other modules.
In sum: good but unaffordable unless you are Verizon.
The Bad
Of course, out there in the wilderness you will find fiber management / outside plant tools that don’t cost an arm and a leg. They are packages exclusively suited for campus fiber management and the like, but they are limited in many ways:
* Usually not web based, and in many cases outdated code
* Limited or no inside plant tracking
* Poor visualization capabilities
* Not enterprise grade (limited reporting, auditing, security, etc)
In brief: affordable but deficient
The Ugly
We have also seen many organizations that cannot afford expensive fiber network documentation tools opt for some sort of custom solution such as by using open source software like Google Earth – or maybe around an affordable tool like AutoCAD. Spreadsheets cannot be used to visualize the data or place objects on maps so migrating to a custom implementation of AutoCAD or similar may feel like a step up. This approach is very common in campus fiber documentation projects or for small to mid-sized fiber base deployments.
However, these tools offer no inherent features for dealing with fiber base or outside plant specific features. They have no built-in business rules to deal with some of the complexities of documenting fiber optic networks, such as: fiber strand bundles, circuit layout records, circuit rerouting, shortest path calculations and so on….the mapping capabilities of these tools are fine, but that’s where they typically end.
In brief: very affordable but very limited
Enter netTerrain OSP
netTerrain OSP bridges the gap between the capabilities users need and the pricing they can afford. You can learn a lot more about its specific features here, so I won’t go into details – but I am going to close out this blog article by providing you with a table summary of netTerrain vs the good (and pricey), the bad and the ugly. Enjoy!