As one of our software’s (netTerrain) applications is in data centers (DCIM), we often hear feedback from data center managers using netTerrain DCIM’s rack diagrams: they love them.
What are rack diagrams?
In a nutshell, rack diagrams are visual depictions of your IT equipment that show where the equipment is placed inside the racks/cabinets. In DCIM software like netTerrain, you can drill down from a building view to a data center floor view to a rack view, and to the equipment’s cards and its ports in seconds.
Have a question about a specific rack? Just find the building, the room, the row, and click to view the rack. Or just run a search to find the rack.
So – that’s what rack diagrams are – now, why do our customers love them? They help them reduce power and lower PUE, save physical space, and overall, save money…
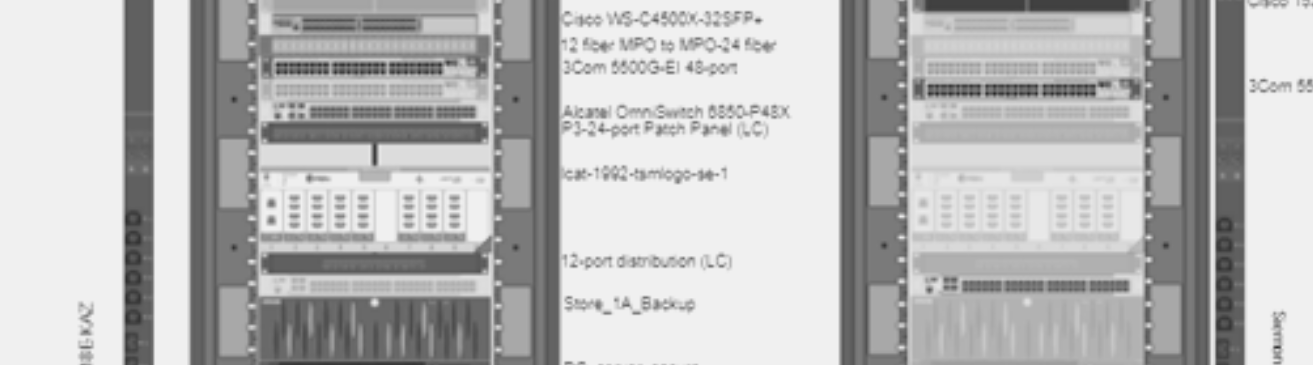
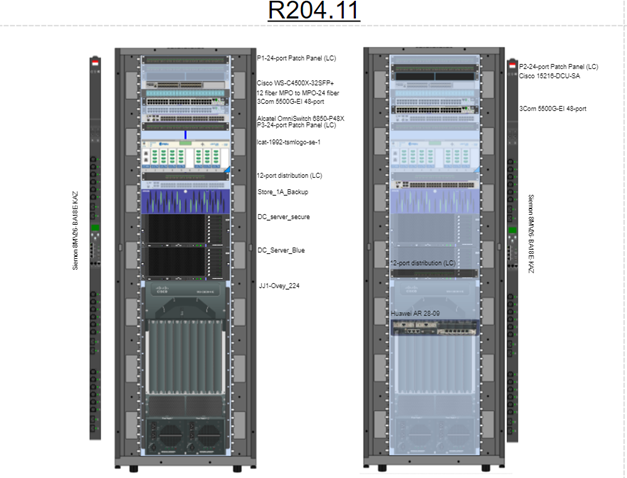 Example: 2D rack elevation diagram in netTerrain DCIM
How Rack Diagrams Help Lower PUE & Energy Costs
Are you relying on nameplate power or static values for your racks? If you are, you could easily reduce your energy expenditures by as much as 30%.
How?!
Nameplate power estimates that cap power can vary drastically from your actual power use — real-time monitoring-related values are what you want to rely on if you can…and rack diagrams help you do that by oversubscribing your racks. Read more about this here.
Our software, netTerrain DCIM, includes our Environmental Monitoring module (a no-cost option – it’s automatically included with the DCIM module): it’s a real-time power monitoring solution that you can use to help reduce your power costs and manage your power policies. Need to find underutilized servers? Looking for a way to oversubscribe rack density without sacrificing power and temperature? Need to track cost per hour or ability to power on/off your servers with a simple click? With netTerrain, it’s easy!
netTerrain rack diagrams give you the ability to show power capacity visually, which can help you view your data center power capacity at a glance.
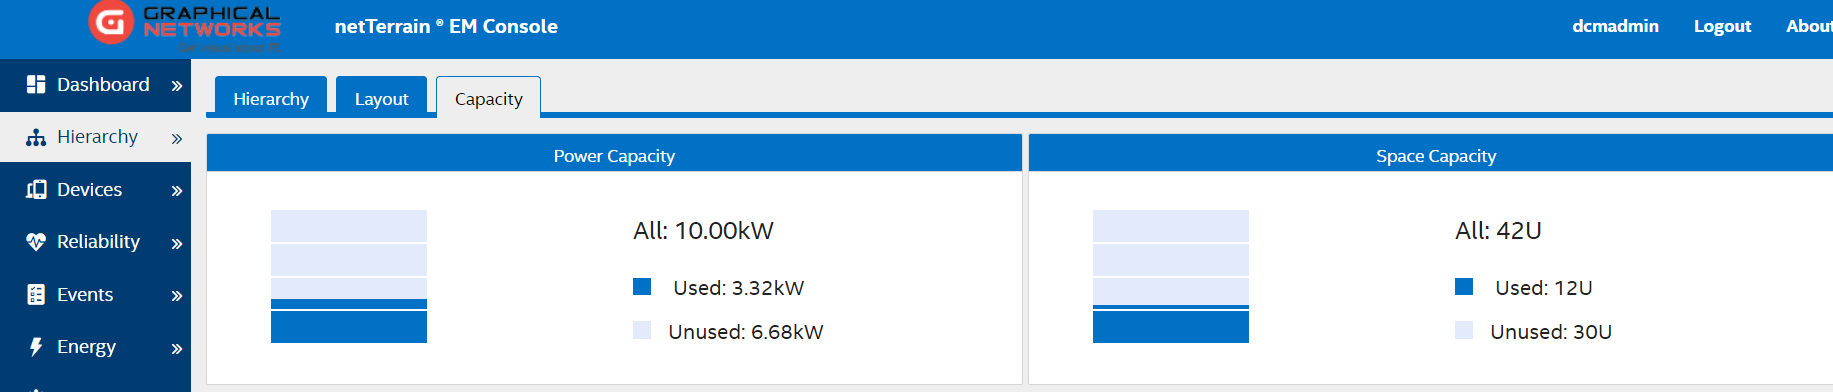 Allocating power is easy with DCIM & rack diagrams
- For more information about netTerrain power monitoring, please click here.
How Rack Diagrams Help Make Capacity Planning Easier
Rack diagrams make it as simple as clicks to manage your capacity and save space. Need to reserve space? Our software, netTerrain DCIM, gives you the option of inserting blanking panels that alert you that the space is reserved — this makes it easy to see at a glance, what space you have free and what space is already planned out. If you need to reserve space for specific equipment, you can find the equipment in the extensive netTerrain catalog, and just drag-and-drop it into the rack diagram — and create a task for it. Once you create a work order task, the equipment will visually change, so you know this space is being used, but not yet deployed.
netTerrain catalog has over 16,000 devices and cards and counting! Can’t find your equipment in that catalog? No worries: just create it yourself or message our support team and we’ll have this out to you in a day or two! Additionally, you can get management-style dashboard data center capacity reports that let you know what your capacity is, such as your capacity by data center room or by data center.
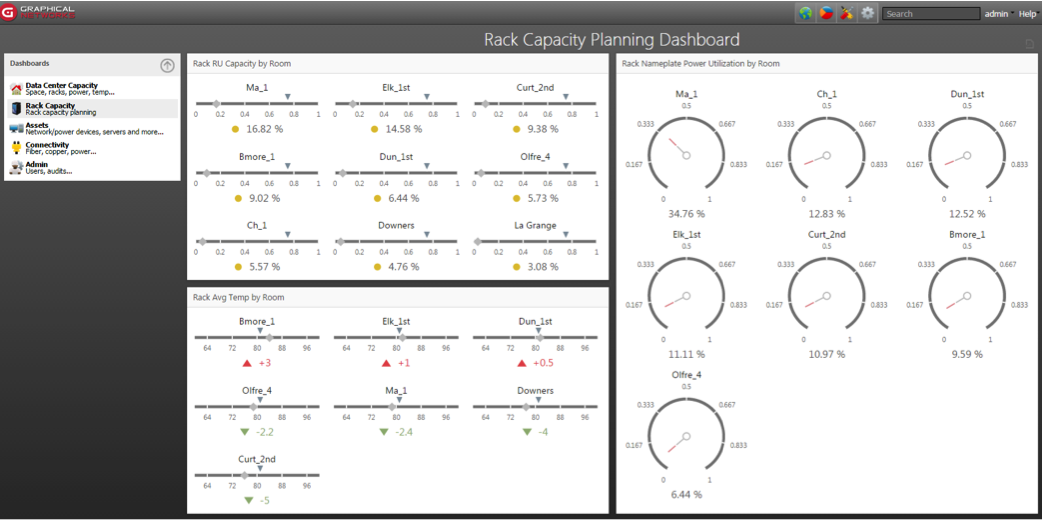 Example: Rack Capacity Report in netTerrain DCIM
- Read more about managing capacity with rack diagrams here.
How Rack Diagrams Help You Save Money
When it comes to making the bosses upstairs happy, it’s all about the benjamin$, right? Rack diagrams make the folks in suits happy, too: they help you save your organization big money — from lowering your power costs, utilizing your rack space to its fullest through power monitoring, and managing capacity of your data center.
If you oversubscribe your rack capacity, for example, you can save money on acquiring additional racks, space, and cooling requirements. You can optimize the racks you have, ensure you’re using available space, and also identify equipment that is sitting in your rack, that may have not been fully decommissioned, that are not performing any functions, and taking up valuable rack space.
- Read more about how to oversubscribe your rack capacity here.
To sum up, visual depictions of your IT equipment, that show you where your equipment is placed inside of your racks and cabinets, help you reduce your data center’s PUE, lower energy costs, save physical space, and save your organization some serious bacon. If you’d like to test drive our software’s rack diagrams, click here now to get started!