In the previous four blogs in this five part series on racks in DCIM software, you learned about: rack basics such as rack mounting, modeling your own custom racks, creating visual overrides for capacity, and rack changes and capacity planning.
What will you learn from the fifth and final (and corresponding video — which begins at 20:22 and ends at 29:13) in this series ?
No true DCIM software system would be complete without monitoring, and while we could spend a whole hour or more just talking about netTerrain’s monitoring capabilities, whether it’s through the Integration Toolkit, the Collector, our SNMP Discovery or our Environmental Monitoring (EM) module, this blog will primarily focus on the EM module.
When you have a rack laid out in netTerrain in your floor plan, the values that you see, in terms of aggregated data, can be aggregated based on the nameplate or static values, or they could be real-time monitoring-related values from your environment, such as power, temperature, and so on.
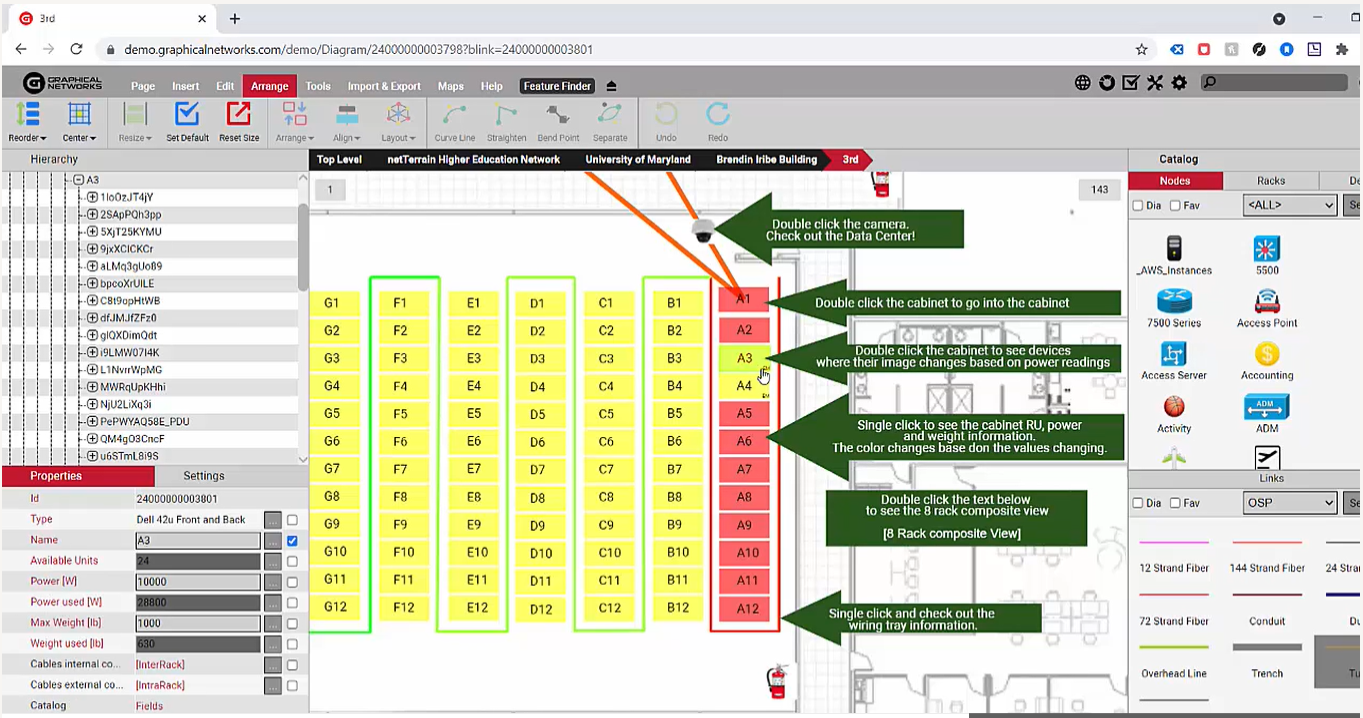 Floor plan in netTerrain
If we drill down into cabinet A3, we have 18 servers and one power bar. The colors on the servers, in this example, are actually data-driven in real-time based on the power and the temperature usage that we have for these servers. For this blog and video, we’re drawing the values from SNMP and IPMI (some of the protocols that we support for monitoring) and we’re using a simulator and a live lab and stimulator.
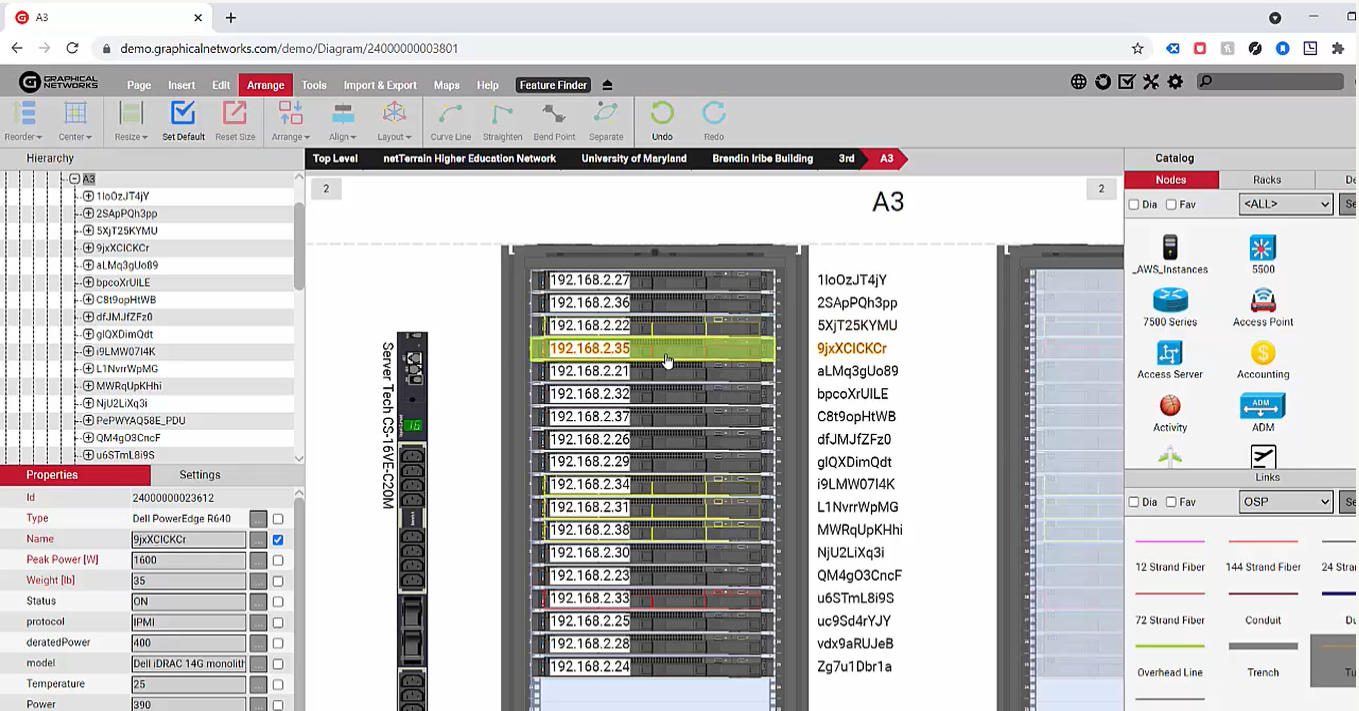 Cabinet A3 has 18 servers and one power bar
By now, you may be thinking, “…but aren’t we talking about racks?”. Good question: what does environmental monitoring have to do with racks?
To start out, we can aggregate the data, as mentioned before, and add up all the power used in real-time, not the nameplate power, but the real-time power ( instead of just de-facto relying on the nameplate or the derated power). There’s actually several power-related parameters here: max power, min power, average power, and so on; conversely, there are several parameters for temperature. This can be aggregated up to the rack level, and it’s done through the environmental monitoring module.
You can load up SNMP or IPMI discovery ranges and then run the monitoring on a per device, per rack, per room, or per entire data center, level.
 netTerrain offers several power-related parameters
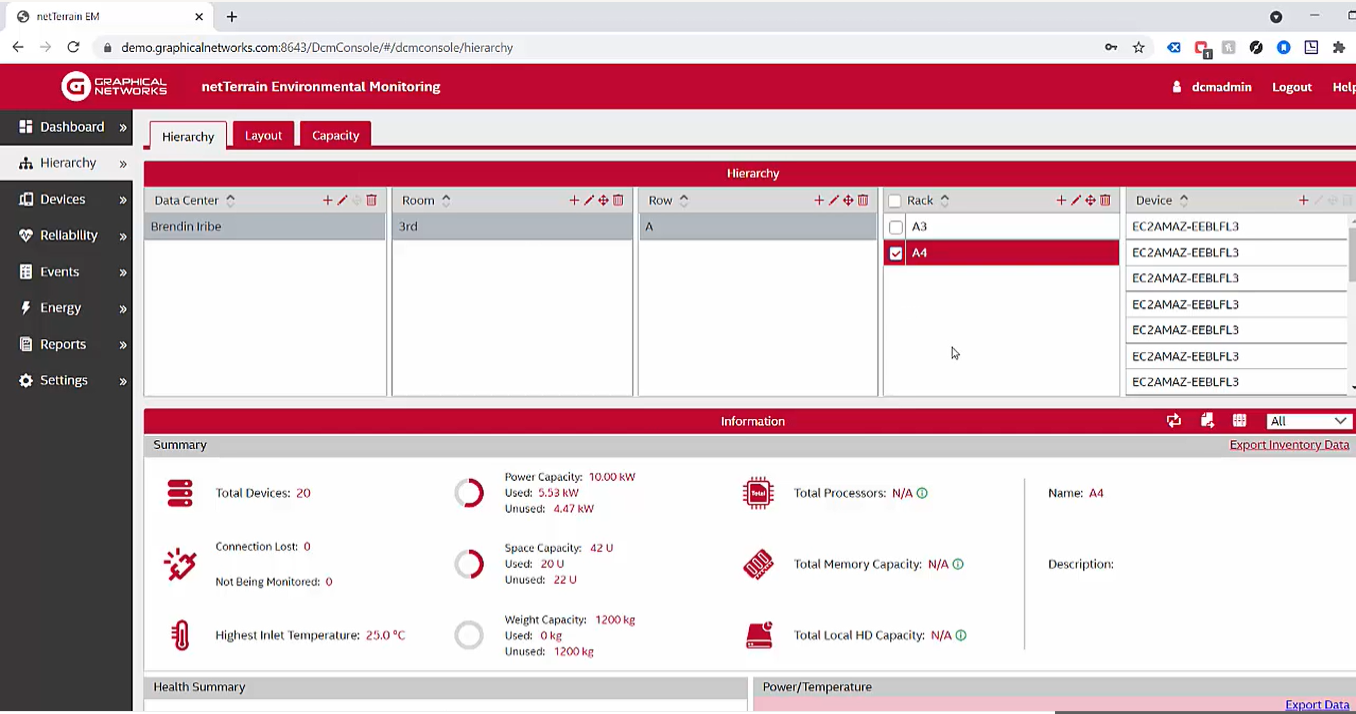
If we click on the A4 rack now, we can see the number of devices that we mounted, the power capacity used, unused capacity, and so on. netTerrain is aggregating the data that I’m monitoring in real-time: in this example, the last reading was just two minutes ago but it’s actually reading more often than that: for the sake of display on the diagram, it says it’s aggregating the data every three minutes.
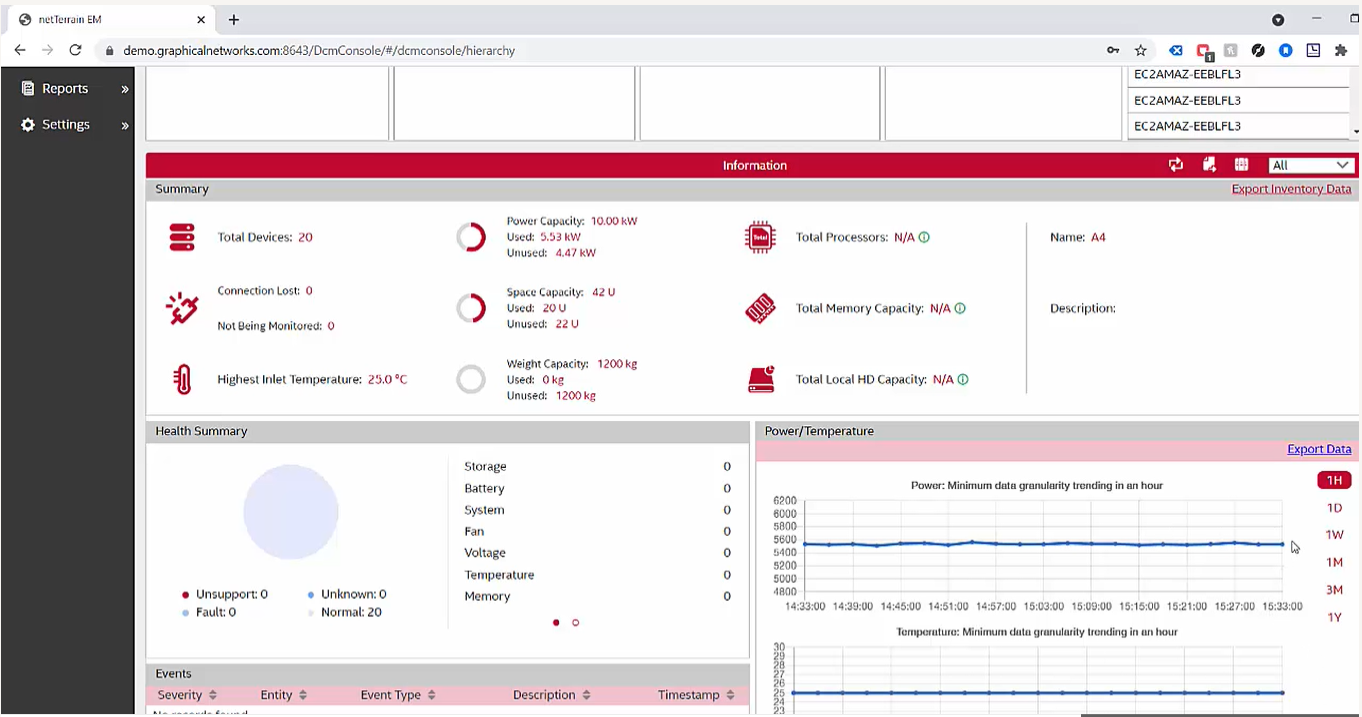 netTerrain aggregates the data in real-time
If you change the charge chart to ‘day’ instead, the aggregation happens every hour; you can change it to week, month and so on.
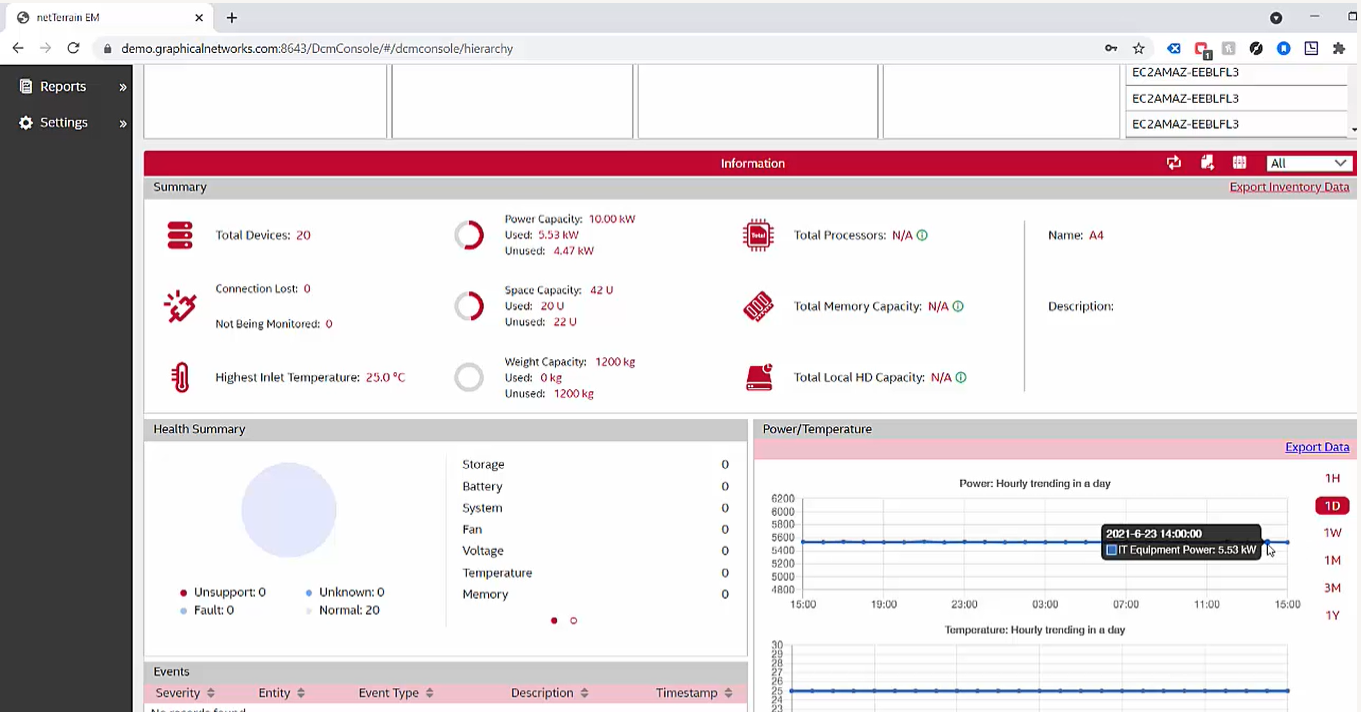 Change the chart to display in whatever way you prefer
I’m aggregating the data with a certain granularity on the rack itself: any alerts associated with a rack, any events and so on, such as a fan failing on the server or some trap that we get on the server and so on, is recorded. I don’t have any events right now, but if I did, they’d show up in real-time.
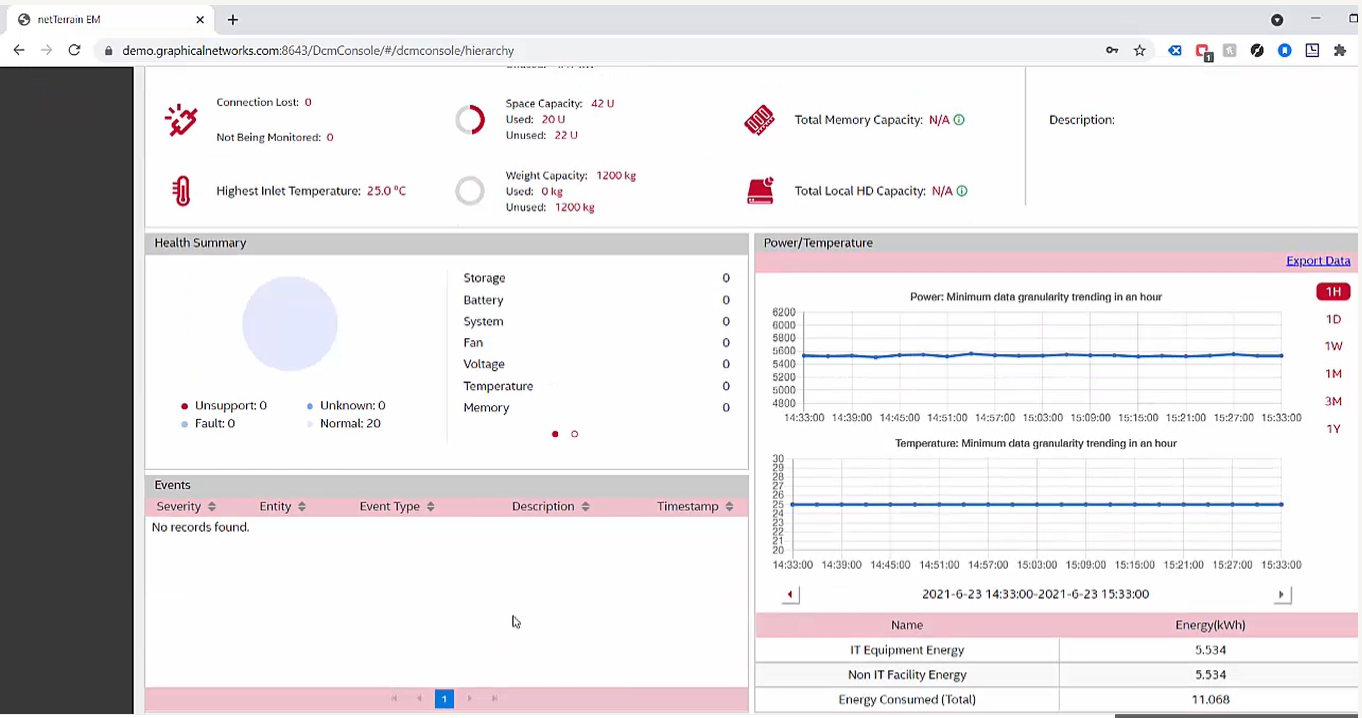 Alerts, if you have any, will display in the lower left box
There are a ton of capacity management features here, but, in this blog (and video), I’m going to focus on how netTerrain lets you oversubscribe racks.
How do you oversubscribe racks?
First, go to the “Energy” tab and create a policy for an object.
 Click the “Energy” tab to create a policy
We’ll have to first choose the entity, which, in this case, is the rack.
 Your entity, in this case, is the rack for which you are creating the policy
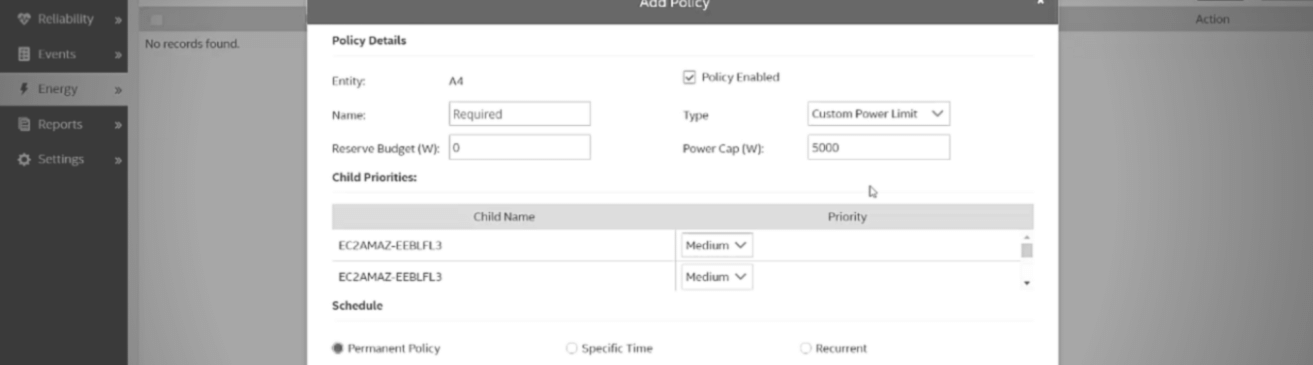
Next, we need to assign a policy, for example: a custom power element with a power cap.
What does it mean if we assign a power cap of 5000 watts?
It means that now, instead of computing the maximum number of servers that we can mount on the rack based on a nameplate power and the power assigned to the rack, we can oversubscribe it and not lose any sleep over a fuse tripping because you proactively power capped the rack!
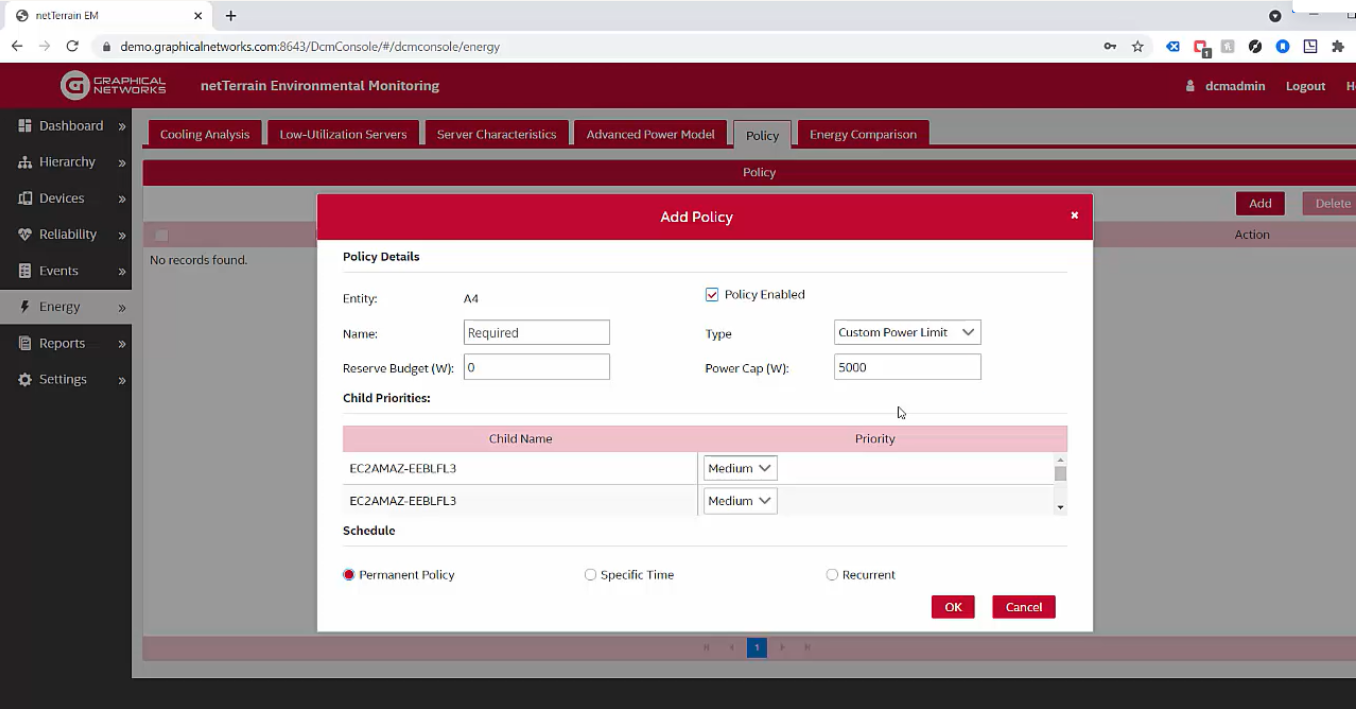 Assign a power cap; in this case, we’ll assign 5000 watts
The way this power cap works is that, in the unlikely event of peaks (aka all the servers conspired against me and all of a sudden I’m running harder than usual, and basically going over the limit of the max power assigned to the rack), the environmental monitoring module will regulate the CPU cycle which then lowers the power usability (power usage) on certain servers based on the priority that you set. It basically limits the cycles on the ones that have the priority set as high last, and instead, it starts with the lower servers first. You can also have a reserve budget in watts and then enable the policy.
I’ll go ahead and name the policy “My Custom Policy”. Setting this policy means that now, on Rack A4, even if we have 5000 watts of power assigned to it (aka available to it), we can start mounting servers beyond 5000 watts in terms of nameplate power and even derated power.
Why? When we look at the power profiles that exist for this rack — in real-time — we’ll detect that it goes way beyond that specific value that we selected (we chose 5000 simply to choose a value). We’ll choose the value based on a safe number that’s above the profile that you see on a weekly or monthly trend.
In this case, I should have chosen 6000 watts in this case for my power cap and then oversubscribed the rack way beyond the 6000 watts. The advantage of this is that you’re now utilizing racks at a better capacity. Consider this: every rack unit in a Tier 3 Data Center costs about $12K (and keep in mind that this number may be outdated as it’s based on a Gartner analysis from some time ago so it actually may be higher today). $12K per rack is for a Tier 3 data center and it only reflects empty racks without any equipment inside.
Why $12K? Well, it counts for the cost of the rack itself, the cost of the real estate it occupies, the cooling of the floor plan, and so on. If you oversubscribe your racks, we’re spending less per used rack unit — and that’s a big benefit for your data center operational costs.
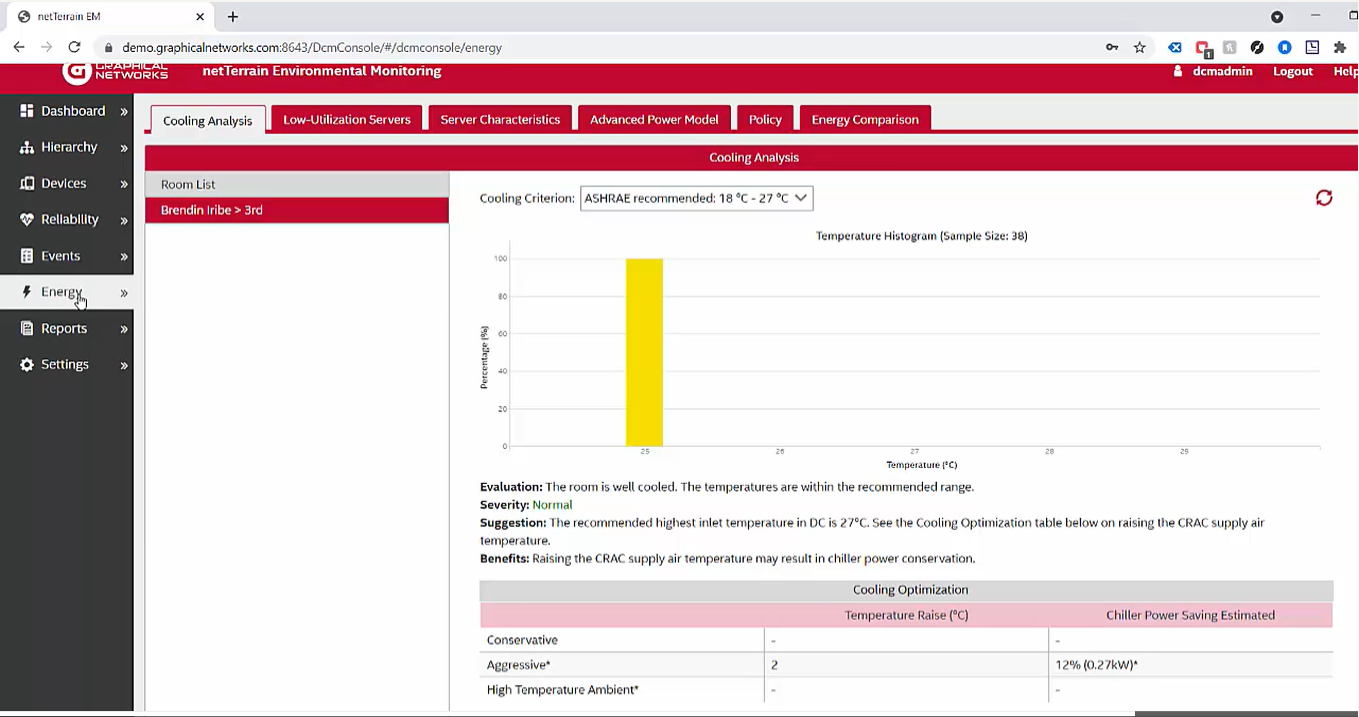
There’s a ton more features in netTerrain for what you can monitor and the environment: you can generate all sorts of reports, temperature histograms, find low utilization servers, zombie servers, and more.
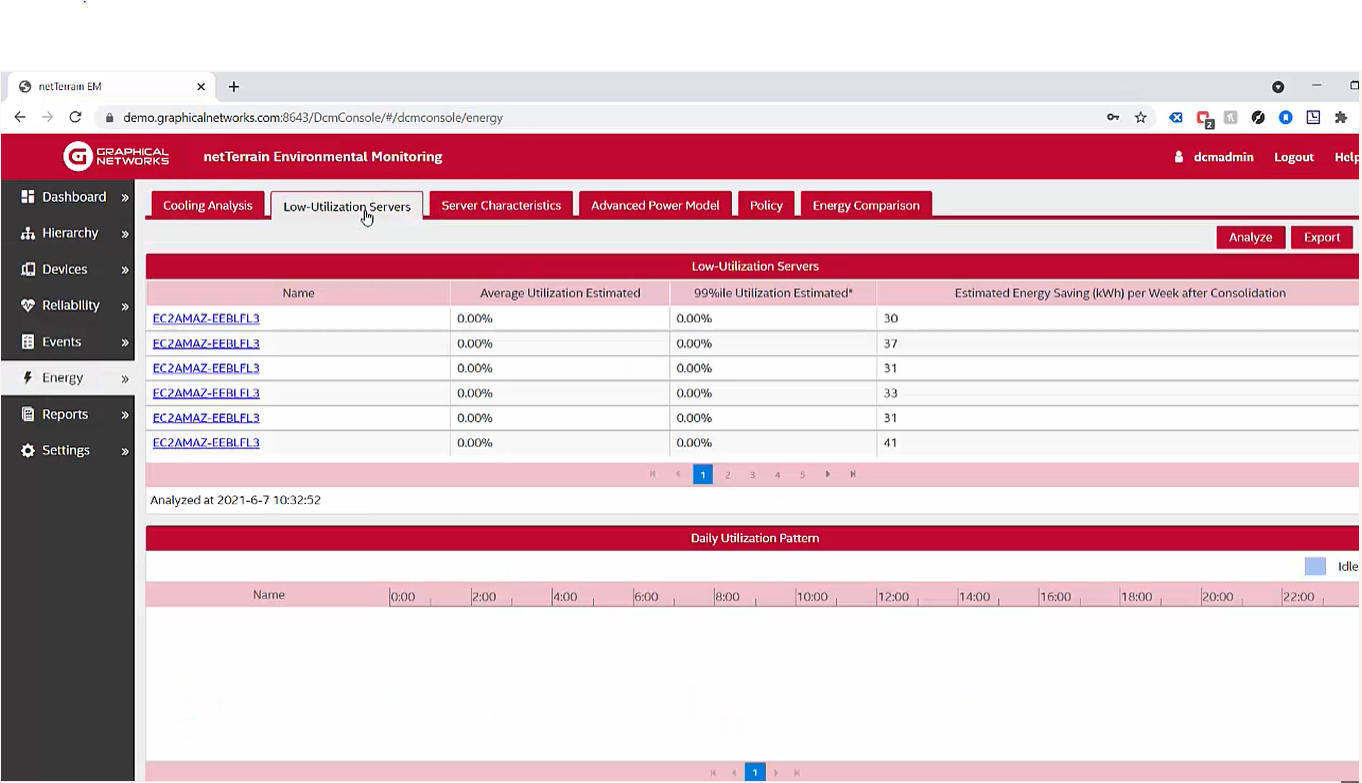 Find low utilization servers and much more…
While these features are outside the realm of rack management, it’s worth mentioning that some of the features go beyond just looking at what you have statically, and instead, give you a more hands-on and proactive approach to capacity management based on real-time monitoring.
In sum, and as you have learned in this blog series, netTerrain DCIM offers you a great deal of flexibility in terms of how you can work with racks. Easily mount equipment to them, model your own racks, use visual overrides for capacity, track changes, and monitor power. If you’re not yet a customer and you’d like to take netTerrain for a test drive, click here to schedule a demo.