
Early this year, the team here at Graphical Networks plans to release the latest version of our IT visualization software: netTerrain 8.5. In the past, I’ve discussed the differences between network monitoring and network documentation…ad nauseum. To review my previous articles, click here.
Some network monitoring systems (NMS) are better than others…for example, can your NMS help you both monitor and manage IT headaches such as capacity, power, diagrams, racks, documentation, and more? netTerrain can.
If you know netTerrain well, you know that we released our new Collector earlier this year. The Collector is our next generation discovery/integrations engine — and it will eventually replace the existing netTerrain Integration toolkit: it comes as a standard feature in netTerrain. The Collector is a thick client and can be installed on your networks. This means that you, the customer, can install the Collector on any number of networks and then simply point the various installations of the Collector to your netTerrain server.
The Collector houses our network discovery (SNMP, WMI, NMAP), and has API connectors to many third party applications, such as AWS, Azure, ServiceNow, Solarwinds, Spectrum, VCenter, and many more applications to automate the population of network diagrams and layout network topology maps automatically. For the benefits of having automated networks, please click here to learn more.
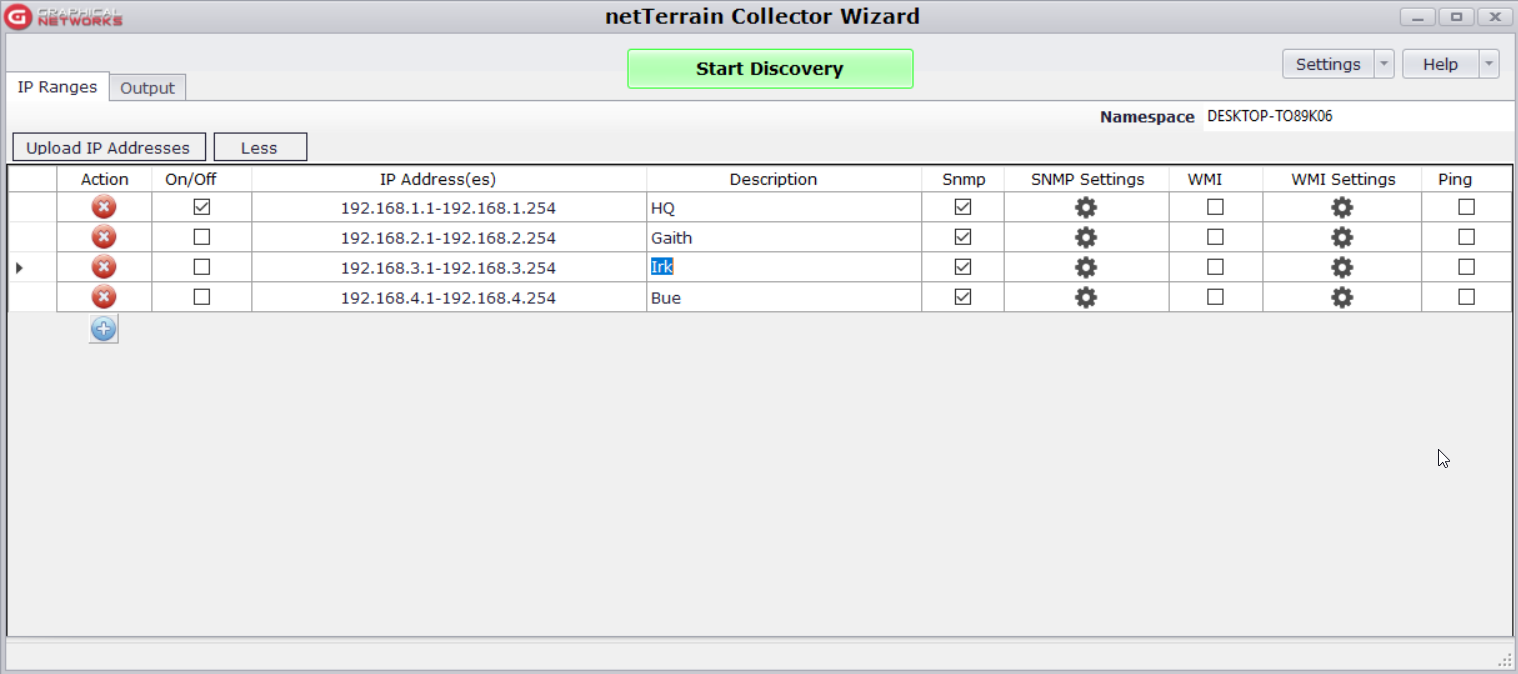 Install The Collector across multiple networks
One of the most frequent questions I get when I’m running demos for netTerrain (DCIM, Logical, and Outside Plant), is this: “do you have alerting capabilities…with email notification, so if a device goes down, is the something netTerrain offers?”
We have always said…until now… “no, not at this time.” Much to my delight, I am pleased to announce that we now offer monitoring capabilities in netTerrain!
This means that now, when using our Collector and our SNMP network discovery feature, netTerrain’s new ‘polling status’ feature will change the appearance of a device to turn red when it’s down (blink, flash, etc…you can choose how you want to see the alert) in real-time and you’ll also be notified via email when a device goes down and after it has been resolved and back online, you will receive an email that the device is active again and changing the equipment back to its original image. Our discovery is agentless, as it uses SNMP, meaning no additional agents are needed.
From its SNMP discovery, its real-time polling status, a web visualization engine to see automated network diagrams, the ability to add your own custom fields and attributes, easily attach documents, create work orders, and, of course, the ability to create your own diagrams (such as physical data center diagrams, logical diagrams, rack diagrams, telecom/comms rooms, and office space diagrams) — netTerrain 8.5’s discovery empowers you to document and monitor what’s needed so you can get the job done easily.
Having a network documentation system along with network monitoring in place will certainly help make the case to your management, that network documentation should be a priority.
So, when is this happening? Any day! netTerrain 8.5 is slated to be released in late January 2020 (stay tuned). netTerrain can be installed on-premise (requires Windows Server, MS SQL Server license) or on the Cloud. If electing for the Cloud service, the Collector is included, so feel free to get a demo and try it out.