
Welcome back to our complaint-of-the-week series. After a rather long hiatus, we’re back again with this series dedicated to unearthing some of the weaknesses you may come across while using netTerrain.
Exposing weaknesses…from a software vendor?
Yep: as good software is an iterative process of improvement, we have no problem exposing some of the things our customers dislike, or, in some cases, features we simply miss or which users would like to see included in our outside plant, data center infrastructure management (DCIM), and/or network mapping functionalities.
This week, we received a rather interesting complaint from a happy netTerrain user who commented that, while liking netTerrain a lot, they were having issues finding the appropriate map for a fiber plant OSP project.
Here’s some background on the complaint: one of the things that customers usually start with, when they are trying to map out their fiber infrastructure is, well, a map…
In netTerrain, we provide maps via OSM (also known as open street maps). OSM is a really cool open source mapping technology that provides GIS functionalities to our netTerrain diagrams.
When you are selecting a map for your fiber diagram, you can pop open a dialog that enables you to browse the whole Earth and to drill down, or zoom in, into the area that you would like to display on your diagram.
Below is an image that shows you how to do this (and by the way, this screenshot also showcases the new design that’s about to be rolled out in netTerrain’s latest iteration: netTerrain 8.5).
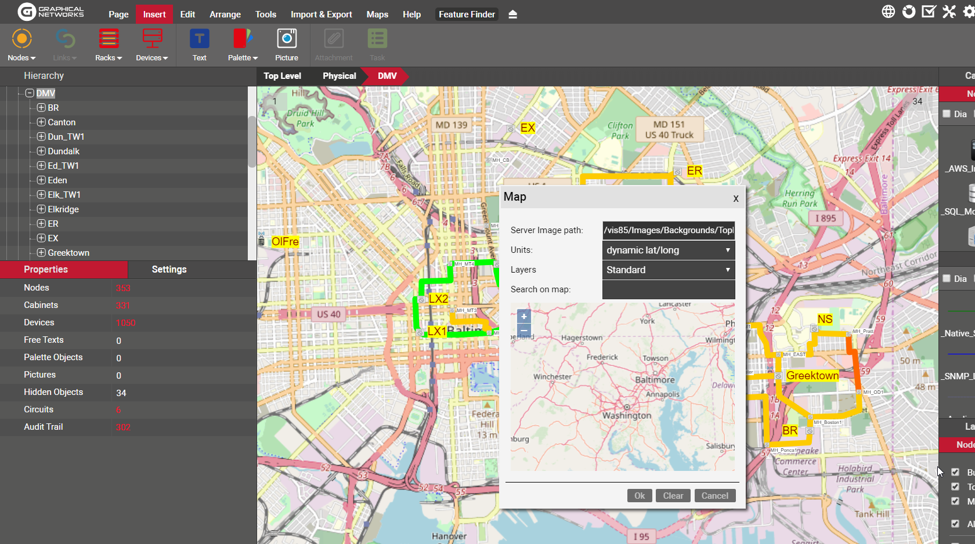 Diagram with map previewer
You may be asking: “what’s the big problem here?”
It just so happens that, when you try to preview the geographical area for the map that will, eventually, be displayed on the outside plant diagram, the zoom levels are fairly discrete, rendering the previewer not continuous across zoom levels.
Or, in other words, the previewer is just not smooth enough.
If you happen to be unlucky enough (or are just really picky about having the exact map boundaries on the diagram), you may end up with a map that is too zoomed in or too zoomed out.
netTerrain needs either a more smooth previewer or a fine tuning zoomer that can adjust the map, after the fact. And we have neither…yikes. That’s the bad news.
The good news is that there is a workaround. It’s not pretty, but it works: you have to tap into the backend database.
To do this, you need to input the GPS Coordinates for the edges of the diagram-in-question into a specific database table. Even better news: we can give you a script that facilitates this so you don’t have to actually enter those values in the table yourself.

Filling out coordinates by hand…yuck!
If you find yourself in the situation in which you need to customize your map coordinates, you can request this script from us and then all you need to do is fill out the top, bottom, left and right GPS Coordinates of the map edges which would correspond to the edges of the diagram.
A warning: this can be a bit of a tricky exercise as you may need to do some trial-and-error for a few cycles. Additionally, as the diagram always has the same aspect ratio, the edges that you choose on the map may not match the edges of the diagram exactly. After some tinkering, however, you’ll eventually end up with a map that’s the right size.
Ideally, we would like to have a fine tuning tool after you chose your map or a better preview were, all available through a simple to use graphical user interface just like the rest of netTerrain. For now, you can use the script and should you find yourself in this situation, request this feature and perhaps we’ll bump it up in the roadmap.
Stay tuned for the next installment in our complaint-of-the-week series…until then, happy documenting!