
If you’re managing a large network of fiber, you already know that finding where it all goes and getting that documented can be a major pain in the neck. When connections don’t indicate your end points, you can find yourself tracking fiber over many miles just to find the endpoint!
Documenting your fiber plant is necessary — especially when it comes to your implementation planning process: it will save you time and material in the installation of your new fiber cables.
Your OSP network engineer can use fiber mapping software — such as an Outside Plant (OSP) solution — which can enable them to efficiently:
- Troubleshoot network issues
- Plan and manage changes to the network
The ability to visualize and report on their network assets and connectivity is crucially important to efficiently troubleshooting and managing capacity. When talking to organizations about managing their cable plant, we often discuss both the inside and outside plant…what exactly is that?
- Inside plant refers to the cabling and equipment installed inside a building. Typically, organizations want to show where the main fiber from the outside terminates inside a building basement for example. You can then, if needed, expand the cabling that can span from the telecom room, data center room, and the office space down to its wall jacks.
- Outside plant refers to the cabling infrastructure located between buildings, such as fiber conduits, duct banks, splice enclosures and junctions, manholes, and poles.
When you have your fiber mapped in a software like netTerrain OSP, some of the common hassles you’re used to are eliminated.
1. Save Time
When you have all of your fiber and endpoints neatly documented in fiber mapping software like ours (netTerrain), it takes a few seconds to answer a question about it. Just open up the software, search, and go: you don’t have to send someone out into the field, or go out in the field yourself, just to get the information you need. This is a significant time saver — especially if you’re managing a large network and have sites that are many miles away.
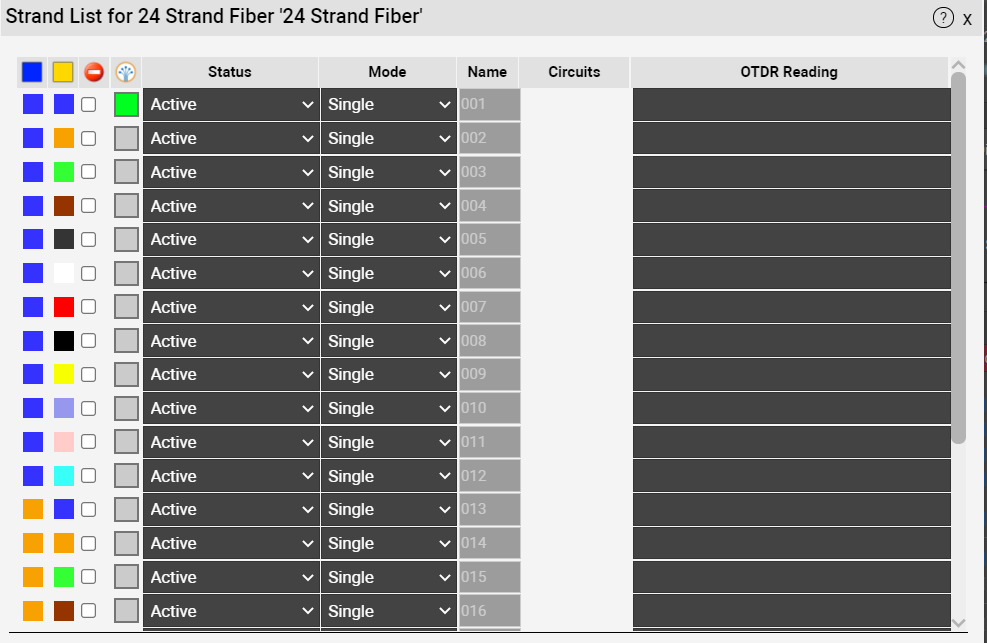 Example: List of Strands in netTerrain
2. Reduce Downtime
If you don’t have your network documented, giving crucial answers when something’s down can take time. With everything documented in fiber mapping software, however, it’s fast to get the answers you need when something goes down: just open up the software and get the answer — such as, “what does this connect to?”
3. Prevent Issues
Hate having to open splice cases? With fiber mapping software like netTerrain, you can see exactly what you’ve got without having to open them and risk damaging something. netTerrain also helps you simplify circuit management and even “makes designing circuits fun” — in the words of one of our customers.
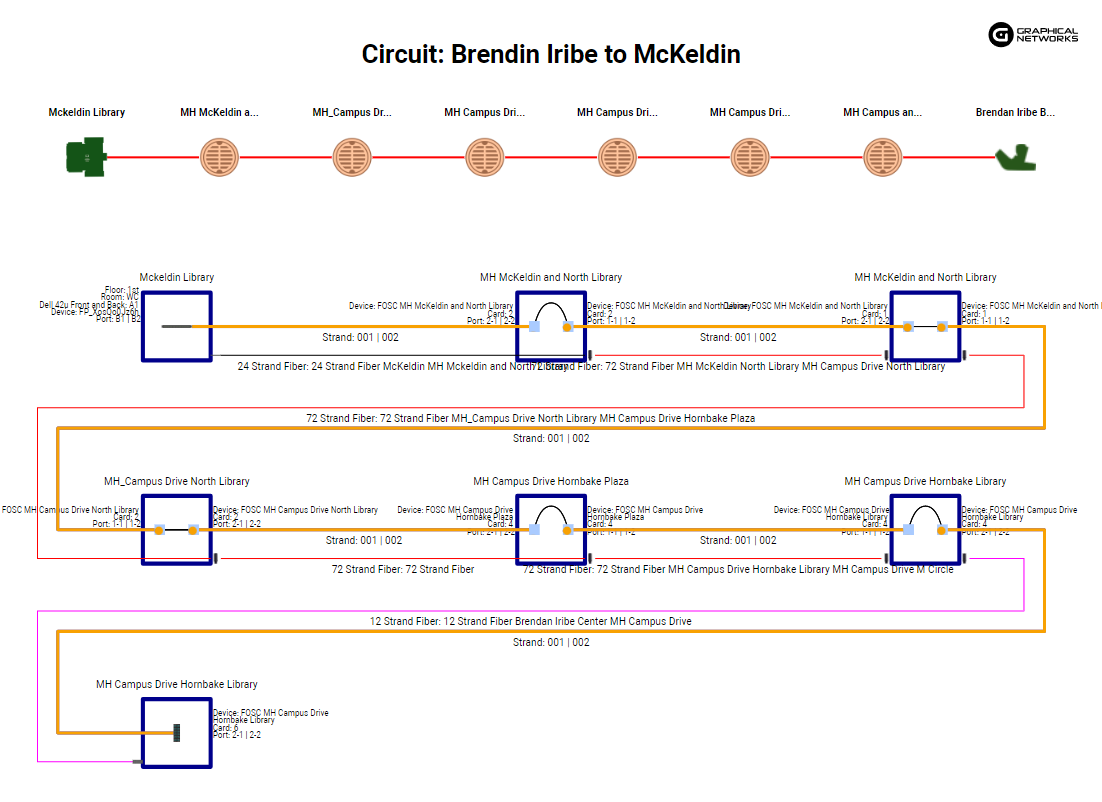 Example: Circuit Layout Record in netTerrain
4. Manage Capacity
Software like netTerrain provides capacity reports to show how much capacity still exists across the cables within a fiber network, all of the way down to the individual strand. For example, if you know that you are only using 10 of a 72-strand fiber through these reports, it’s safe to say you can light up these available strands and use your budget for another project elsewhere. With these reports, the OSP network engineer can deploy their resources more effectively, knowing how much capacity they have left to use for new projects.
So…is it time to migrate from your spreadsheets, your AutoCAD, and Google Earth diagrams to a cable plant software, like netTerrain? If any of this resonates, please do reach out to Graphical Networks Sales to schedule a demo so you can try netTerrain and see if it would be a good fit.