
If you were to make a list of mission-critical assets in a data center, cables would near the top. They provide connectivity that lays down the tracks on which the data center runs. From copper to fiber and everything in between, data centers contain a wide range of cabling.
Regardless of whether the cables are for power or data, it’s essential to properly manage, document, and visualize your cabling infrastructure: not having a cable management system as part of your DCIM strategy, can cause serious issues — from increased operating costs to expensive outages. Cable management must be part of your overall DCIM solution and cannot be an afterthought.
A DCIM solution can provide you with the cabling/connectivity metrics that allow you to track your network capacity, identify trends, and manage network assets. While tools such as Visio or spreadsheets are difficult to glean actionable insights from, DCIM software (such as netTerrain) provides helpful reports, such as business intelligence dashboards to track your key performance indicators (without spending time trying to find information or manually build your own reports).
Along with the assets in your data center and telecom rooms, you need to ensure that you have enough data ports, power ports, and cabling to connect your assets in the current layout of your data center. Besides the number of open data and power ports, consider tracking cabinets with the most available power and data ports, data port usage, types of data ports, and number of power circuits, and capacity reports. Dashboard reports and tables can help you get your cabling under control.
Examples of cabling reports include:
Dashboard Reports
In one of my previous articles (on data center capacity) I discussed the many ways to utilize the dashboard reports for managing capacity (space, power, weight) and cables.
The netTerrain Dashboard contains pre-built reports for viewing of leading Key Performance Indicators (KPI) of organizations, such as: data center and network assets, connectivity, power, and space utilization (and these reports can be exported to .csv).
For Cable Management, you can get reports on where your links are, endpoint connectors, how types of links are distributed, and drill down to understand more about your cable usage. Find out, for example, how much fiber you are using as compared to your usage of other types of cabling.
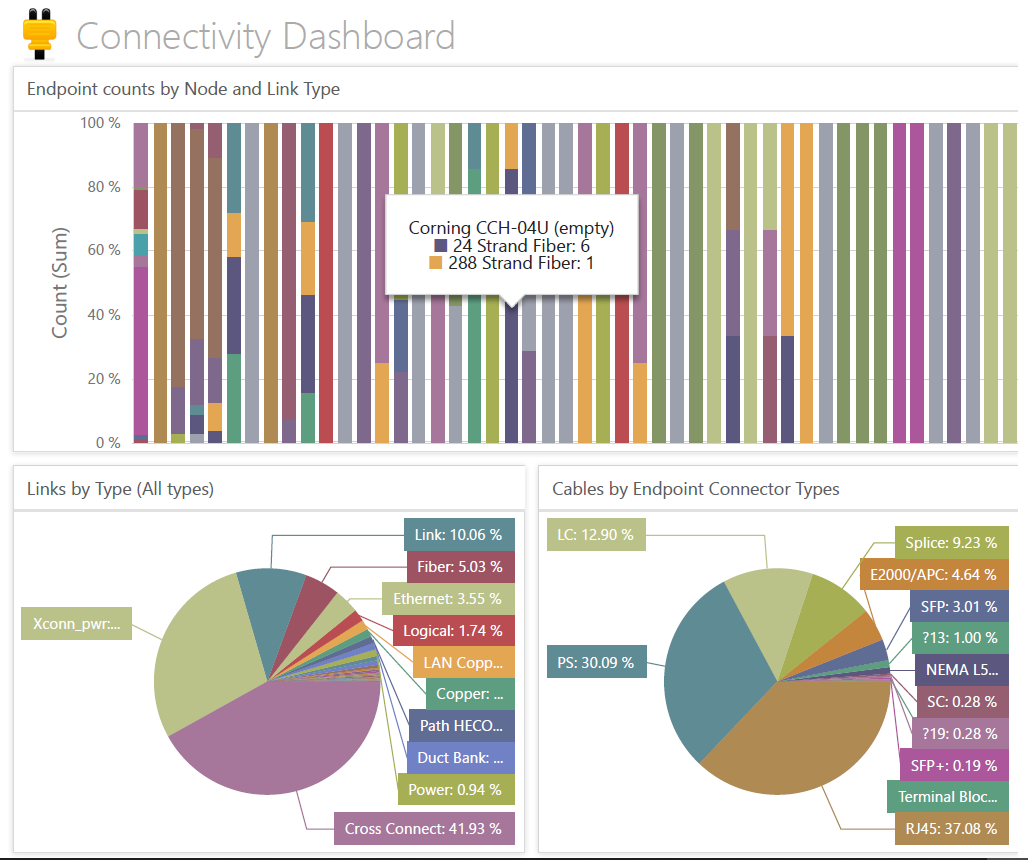 Example of a Connectivity Dashboard in netTerrain
Table Reports
With table reports, it’s easy to pull a report to see all circuits, cable trays, ports connected, and ports that are not connected for this entire project. netTerrain’s included customer support means you can request as many custom table reports as you’d like. In addition to table reports, there are built in at-a-glance reports on a per-site, building, data center room, and down-to-the-individual racks basis.
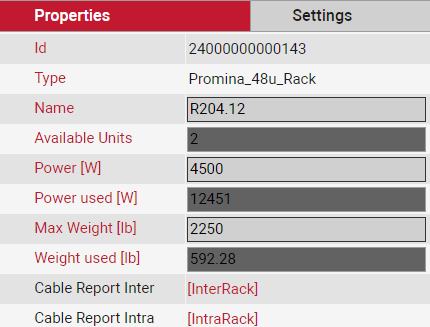
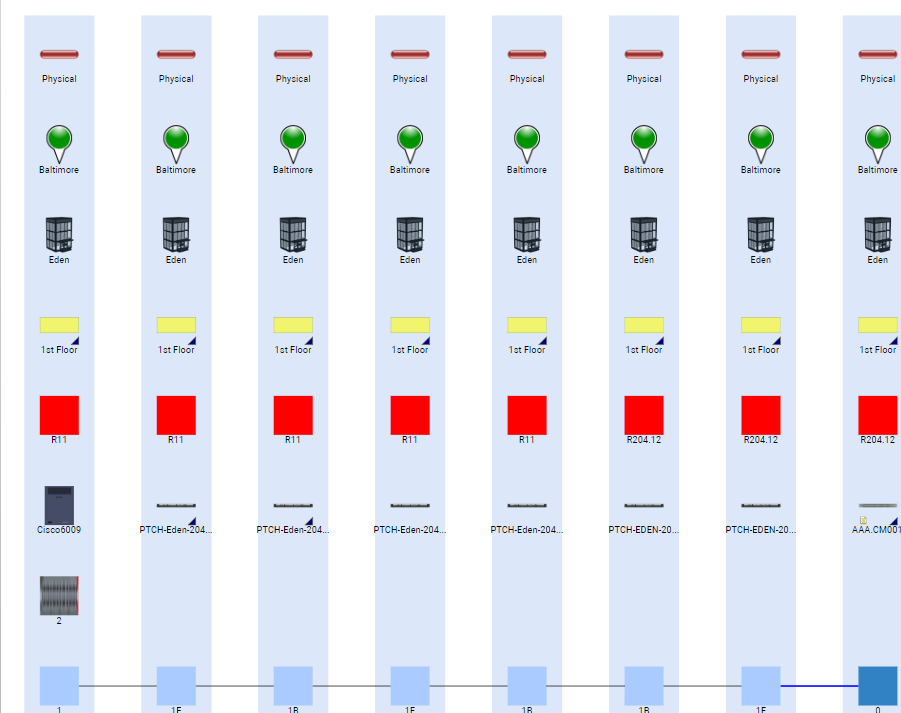
Easily view all connected ports, available ports, view all the cables inside the rack, as well as cables leaving the rack to other points outside the rack (see Illustration below). If you are documenting and visualizing cable trays, you can also view the cable tray reports.
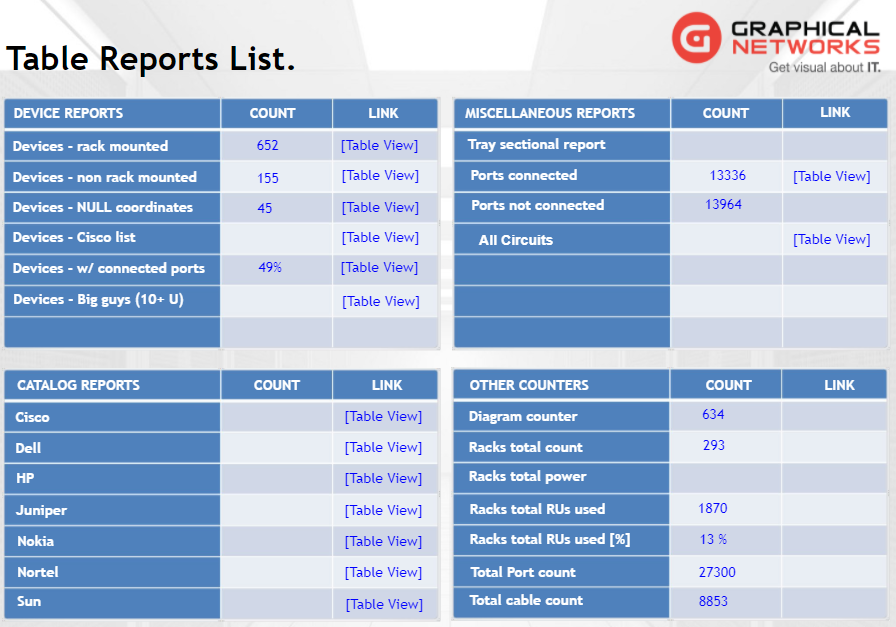 Example of Table Reports in netTerrain
Circuit Layout Records
Circuit Layout Records (CLR) are not reports per se, but for managing cables, the CLR in netTerrain creates an end-to-end view of a connection between two endpoints, on a single page. These CLR reports are useful to see a full path of a cable and to find any zombie cables. For a detailed explanation on the two types of circuit layout records, please visit my colleague, Jan Durnhofer’s article about CLR’s here and also our discussion about zombie cables and cable management here.
 Example of a Circuit Layout Record (CLR) in netTerrain
By not having a cable management solution in place, cabling installations can cause needless headaches for data center managers and network engineers. Reports provide key information that help you manage capacity and assets…and reduce headaches in the data center.