 Lately, I’ve been working on a great deal of OSP projects. While the scope between these different outside plant projects can vary a bit: some may be limited splicing and some may be heavy on the splices. One common thread, however, is how hard it is to track all of this information.
While inside plant cables remain relatively static, outside plant fiber is an entirely different beast. With inside plant cabling, there is some movement — but you know where the patch panels are and how they’re connected (not always the case, of course, but typically you’re not cutting an Ethernet cable in half and then splicing the inner strands together). With fiber cabling, however, this can happen often.
When you have to do things — such as cut cabling in half and splice inner strands together — you’re making the task of managing a large fiber network that much more complex. If you are managing just a few thousand strands of fiber, or maybe 10’s of thousands of strands — the task of tracking all of it can be extremely complicated (let alone trying to visualize and understand it all). Databases are the way you track this information, but when it comes to really seeings and knowing what you have and where it is: a picture is worth a thousand words (or a thousand strands).
Trying to manage thousands of fiber strands without visual guides is like trying to manage in the dark. When it’s time to find what fiber is in use or not, how you can you do so expediently without a visual guide? If you’re trying to do this with databases alone, the effort you must invest for things such as planning and reporting shoots up dramatically.
With proper outside plant and fiber plant software, you can transform the way you manage the network. The right software can give you a bird’s eye view of what you have – from the fiber splices to manholes all the way up to GIS-enabled views at the street level (with 6-decimal precision).
With our outside plant software, for example, you can easily create both inside and outside maps and diagrams. Once you’ve created a map (from scratch or with a template), you can start placing whatever objects you’d like — from antennas, to poles, towers, manholes, conduits, handholes, and really anything you need to track. You can track any kind of inside and outside plant cabling: fiber, copper, circuits, you name it. It’s easy to create and automatically bundle in the duct using the cable mapper. You have the ability to fully view circuits — and their entire components — in clicks.
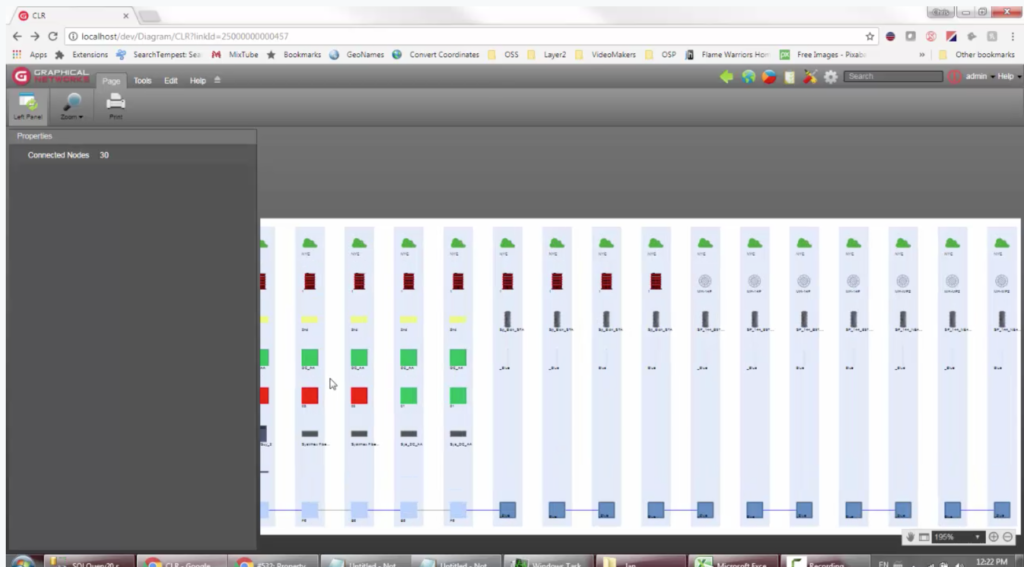 Example: Trace circuits with outside plant software.
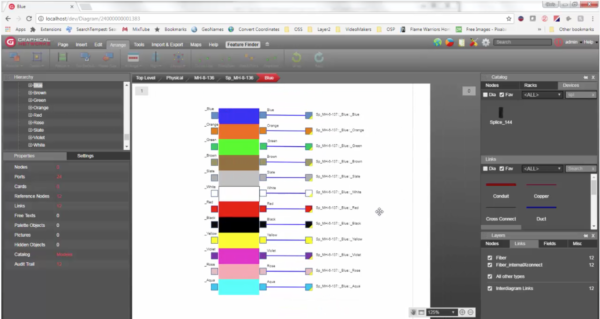 Example: bundle fiber automatically with outside plant software.
To sum up, if you’re using Excel or some kind of homegrown database to manage your fiber and outside plant network, it may be time to consider a visual software solution. Regardless of what you need to do, when you’re managing a large network — you can save considerable time, hassle, and money when you can actually see and fully understand what your fiber plant has and where it all is.