Welcome back to our series on managing your outside plant with dynamic maps: in this second installment in the series, you’ll learn how to place manholes, conduits, and ducts within your outside plant diagrams.
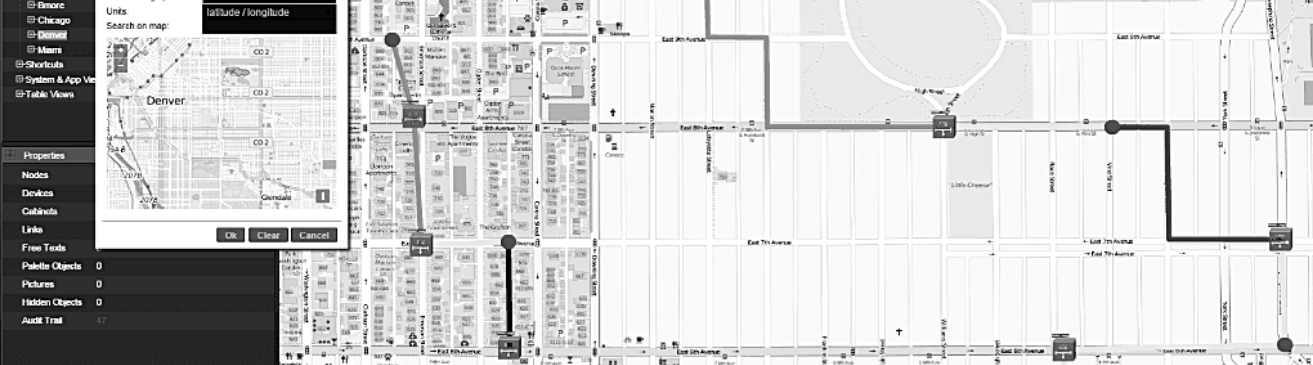
In the introduction to this series, you got an overview of how you can create maps in netTerrain. To recap, these are dynamic maps: they use OpenStreetMaps to georeference your outside plant assets (with up to 6 decimals of precision).
Once you’ve created a map, you can start placing different types of outside plant related objects. These objects can be poles, towers, antennas, and the usual suspects: manholes, handholes, conduits, and so on. To see any of the points we cover in this blog in action, you can watch the corresponding video by clicking here.
The three types of objects most frequently used are:
- Manholes
- Conduits
- Ducts
Adding Manholes (& Objects)
Because manholes and conduits are typical examples of objects placed at the map level, we’ll start with these. You can place a manhole on one part of the map, place another manhole on another part of the map — and then join them with a conduit. Inside the conduit, you can have a bundle (or an association) of ducts. For these, you can set a number of 4, 8, 12, or however many you need (it’s up to you).
How do you bring in your manholes in the first place? If you have them in a spreadsheet, you can use our spreadsheet import. If you have them in a database, you can use the Integration Toolkit to bring them in. In both cases, you can use existing lat/long values to place them, automatically, on the map.
For the sake of demonstration, we’ll assume you don’t already have your manholes on a spreadsheet or external system. You’ll need to create them manually. Go to the catalog and search for some object that is a manhole (you can use the predefined catalog that we ship with, or you can create your own, or request them from us as part of your maintenance).
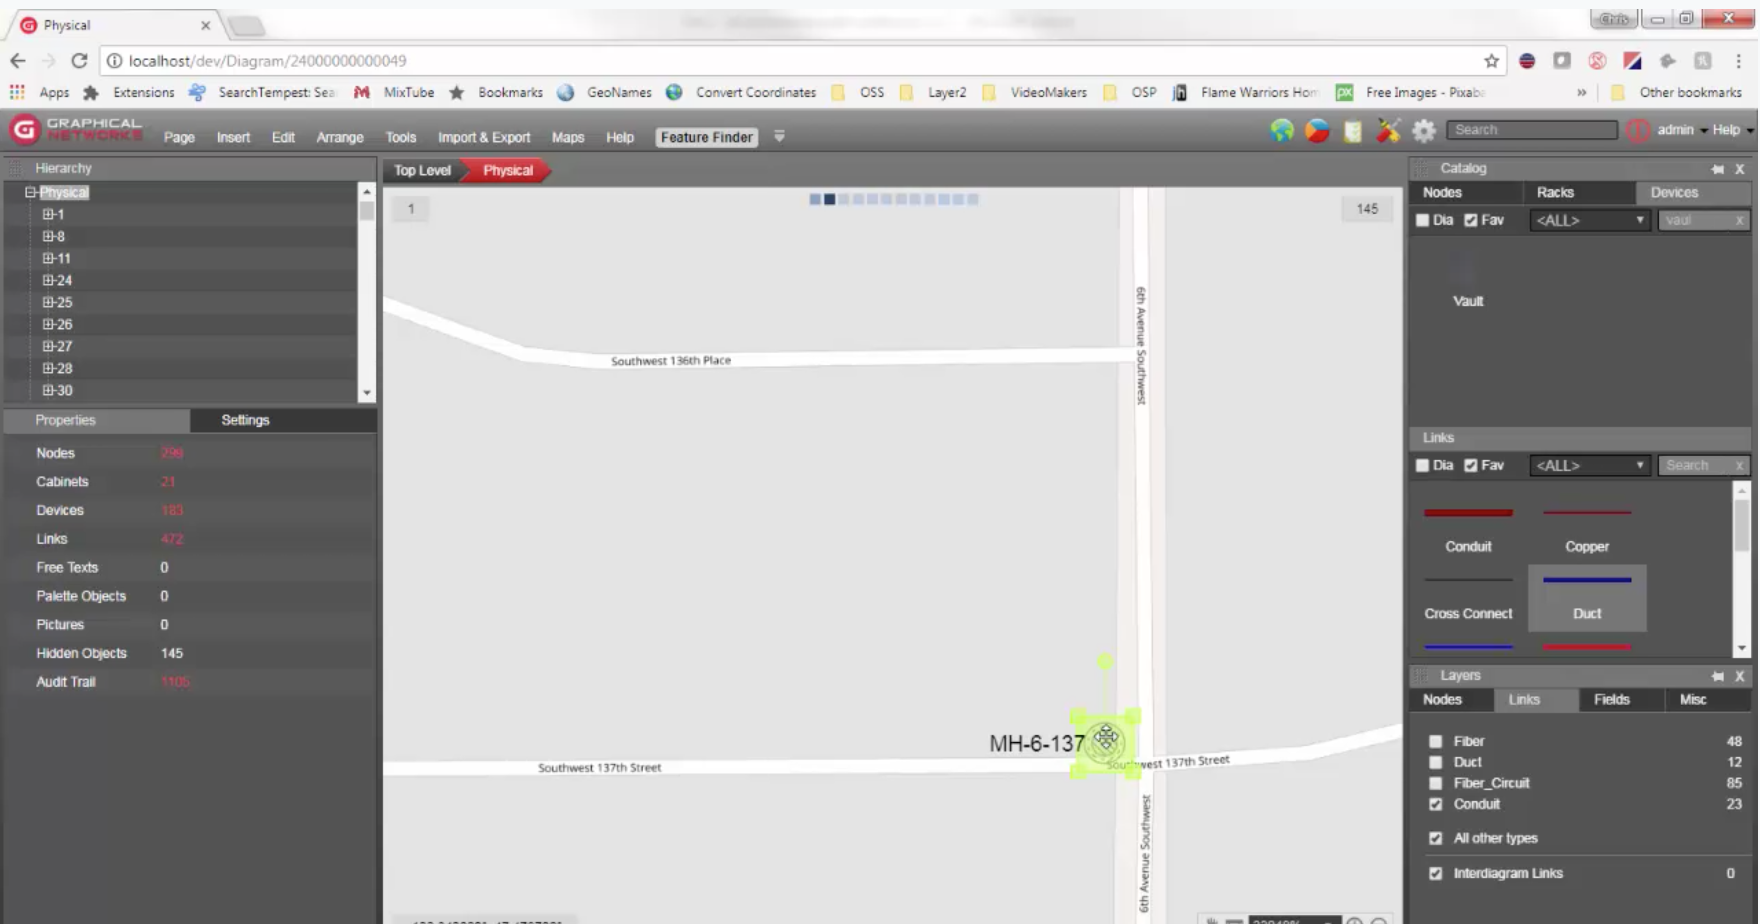
Let’s bring in a manhole from the catalog and drop it on the map. You can then rename it: click on it and edit ‘Properties’ on the left). Type in your preferred name – in this example, we call it ‘MH-136-8’.
Let’s drop another one on the map — we’ll name this one ‘MH-6-137’. What are the general components of a manhole?
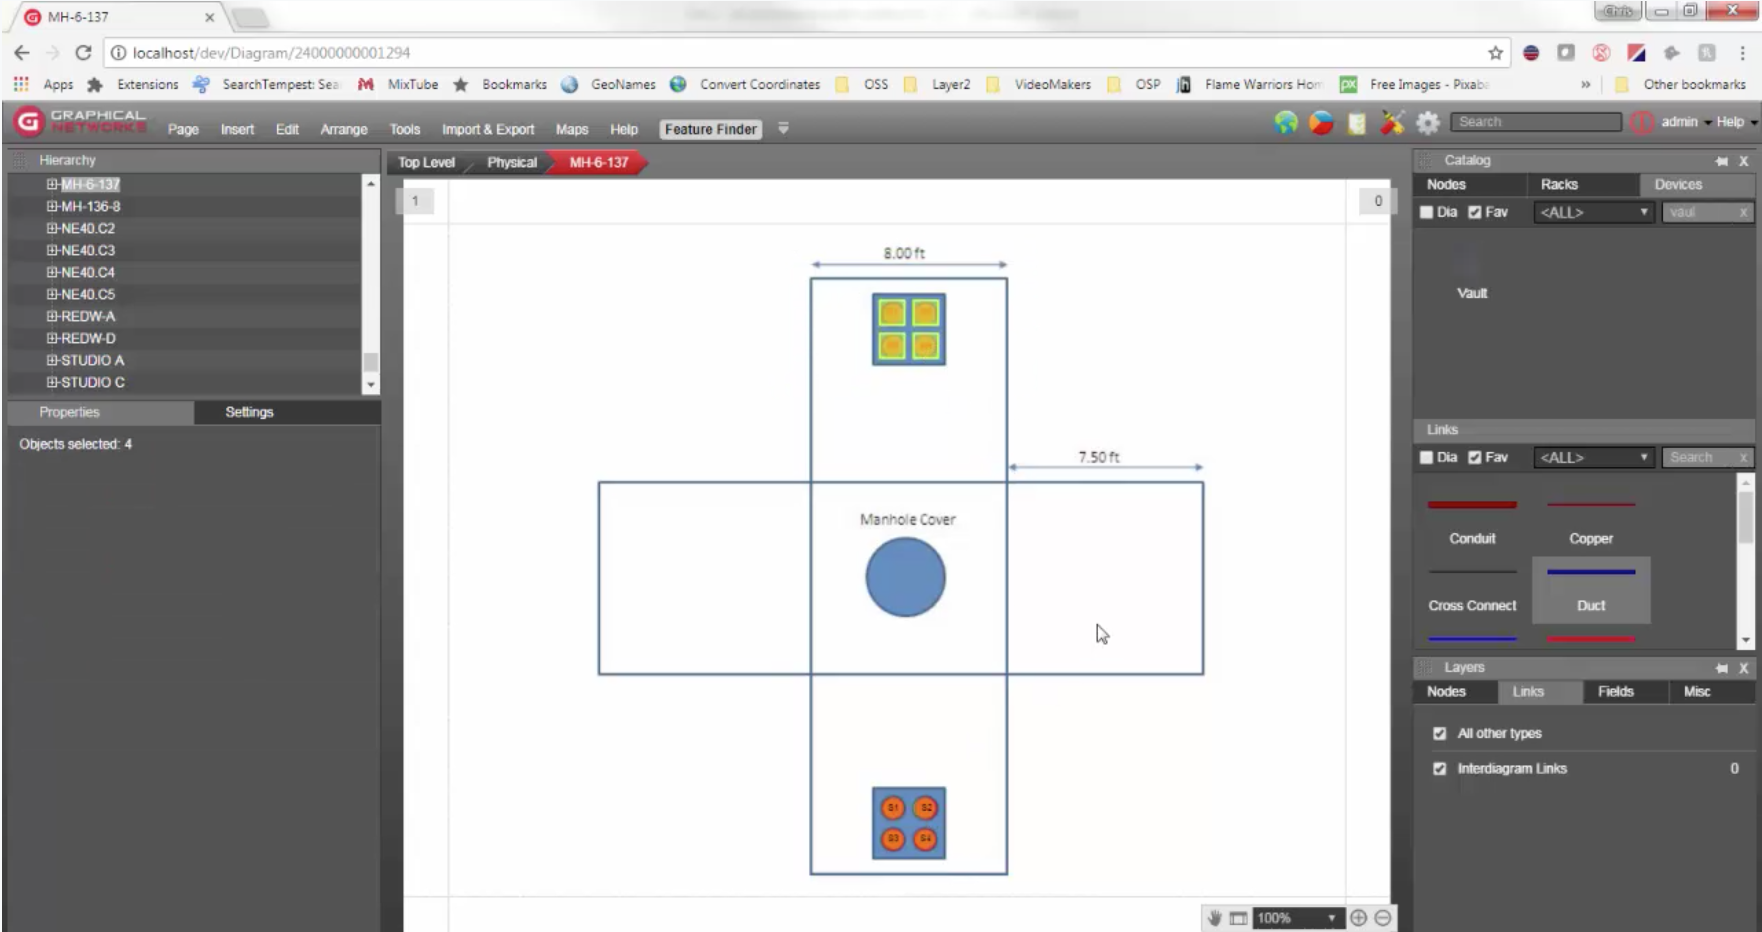
You can drill down to see. While these manholes are actually modeled as devices in the catalog, they are not actual devices. We do this because they are ‘smart’: when you create the manhole, or the vault, it already has a specific butterfly diagram – and maybe it has some ducts represented.
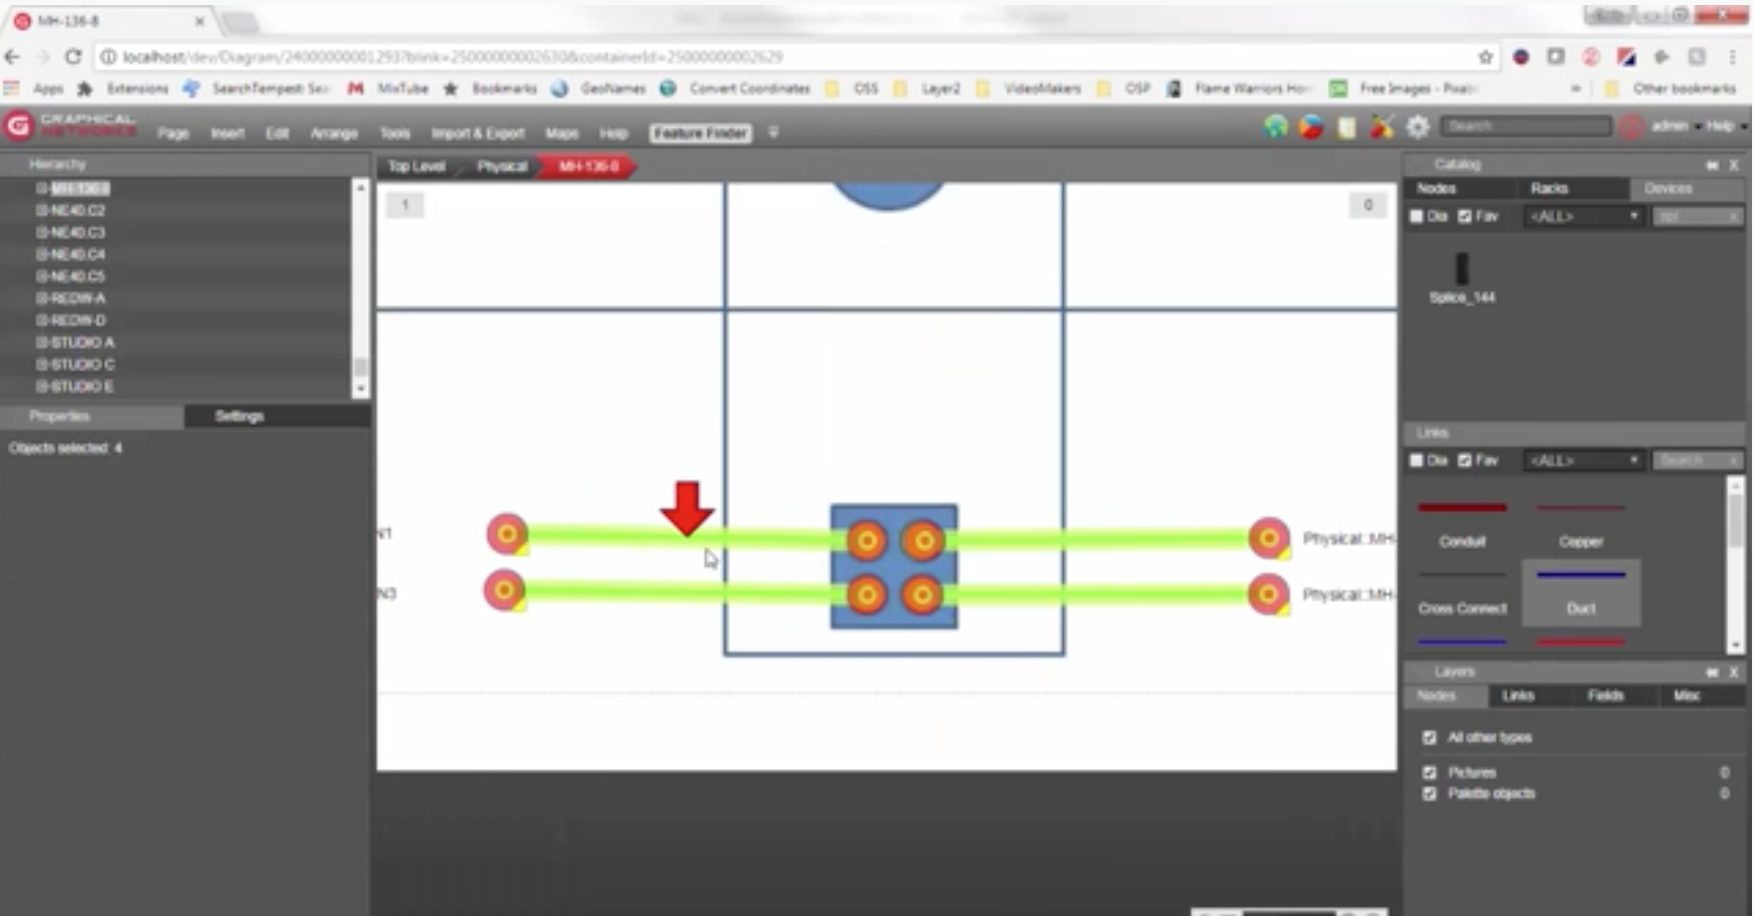
Below you can see the duct starting and ending points — these are typical components of a manhole.
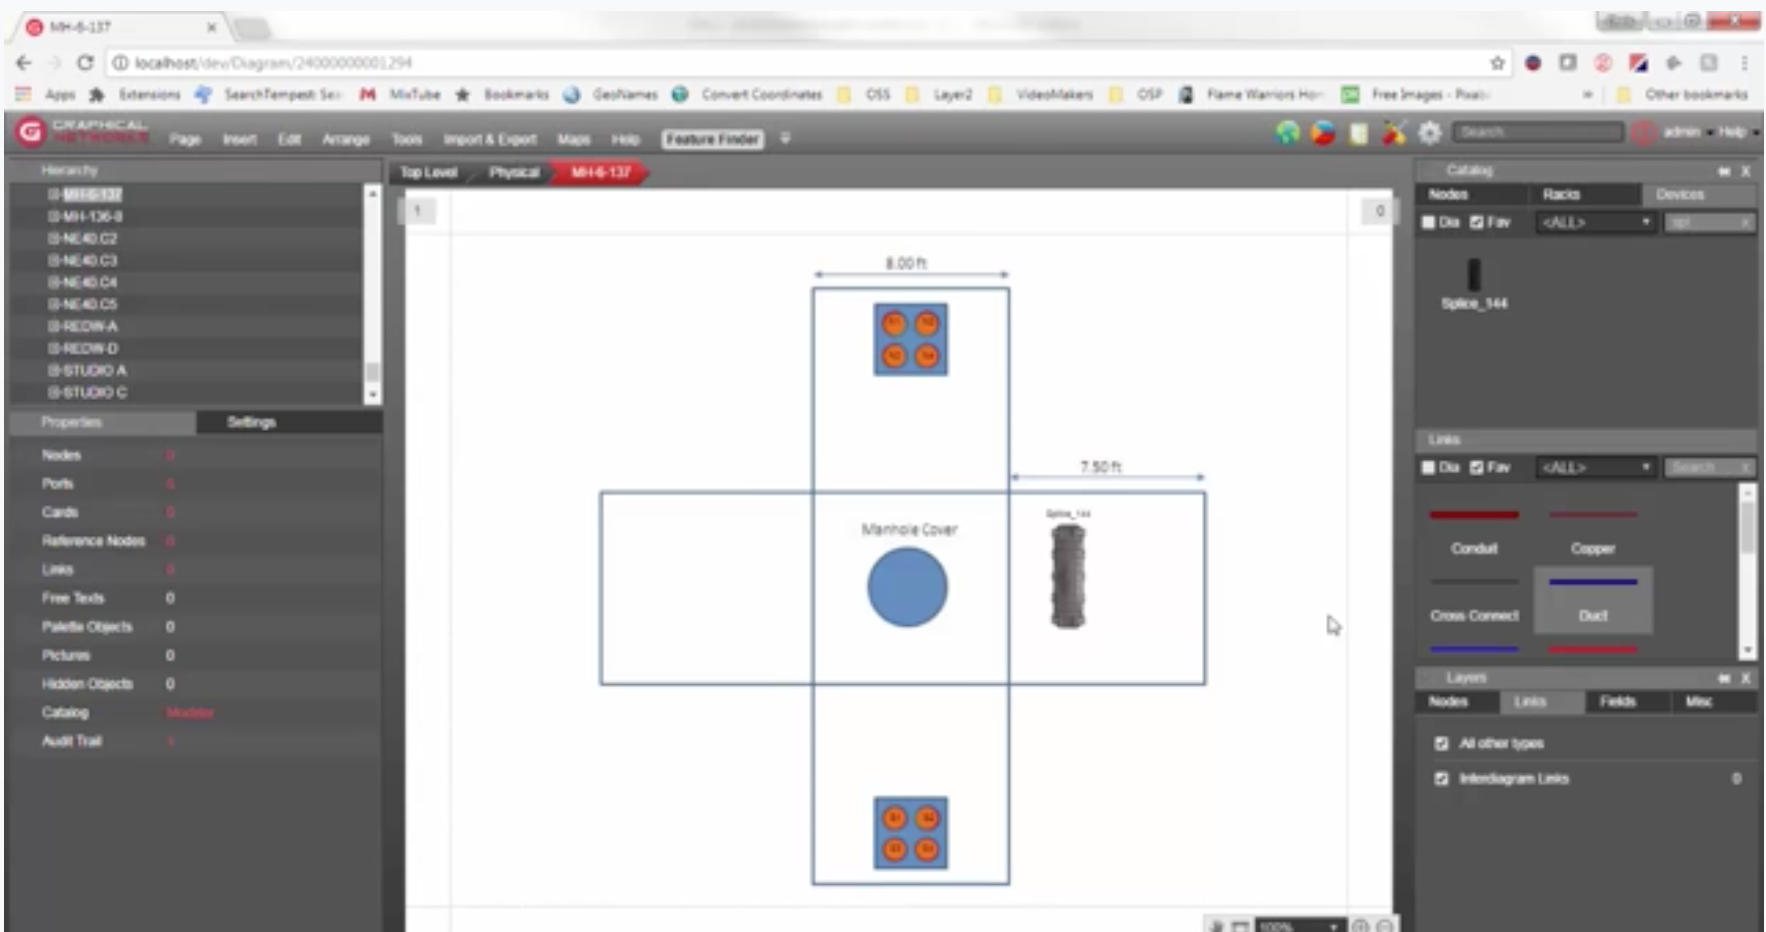
The manhole can have enclosures or splice boxes inside. In this example, we’ll add a splice box that has a capacity of 144 fiber strands. Of course, you can add any OSP elements that you’d like documented inside of the manhole.
Inside of the manhole we named ‘MH-6-137’, we have both the north part of the ducts and the south part of the ducts. Note: north and south are just what we call them here. Your project may be different — it’s completely customizable (including the splice box).
Below, you can see the splice box dropped inside of the manhole. You can watch the video to see this in action (you can skip ahead to 4:00 minutes in).
Working with Hierarchies
We have these two manholes here. They are usually joined by conduits (again, in your project, it may be different and you may just work with ducts directly).
You can have as many levels (aka hierarchies) as you want: not just nodes, but also what is generically called a ‘link’ in netTerrain (a link in netTerrain is anything that connects two nodes).
To clarify, when I say unlimited hierarchies, I mean this: you can have a conduit which inside of it has a number of ducts which have a number of microducts — and each microduct has a fiber trunk and the fiber trunk has fiber strands.
In this example, we’ll have three levels:
- Conduits
- Ducts inside the conduits
- Fiber strands (we’ll associate fiber strands with ducts in a subsequent blog and video)
Linking Two Manholes
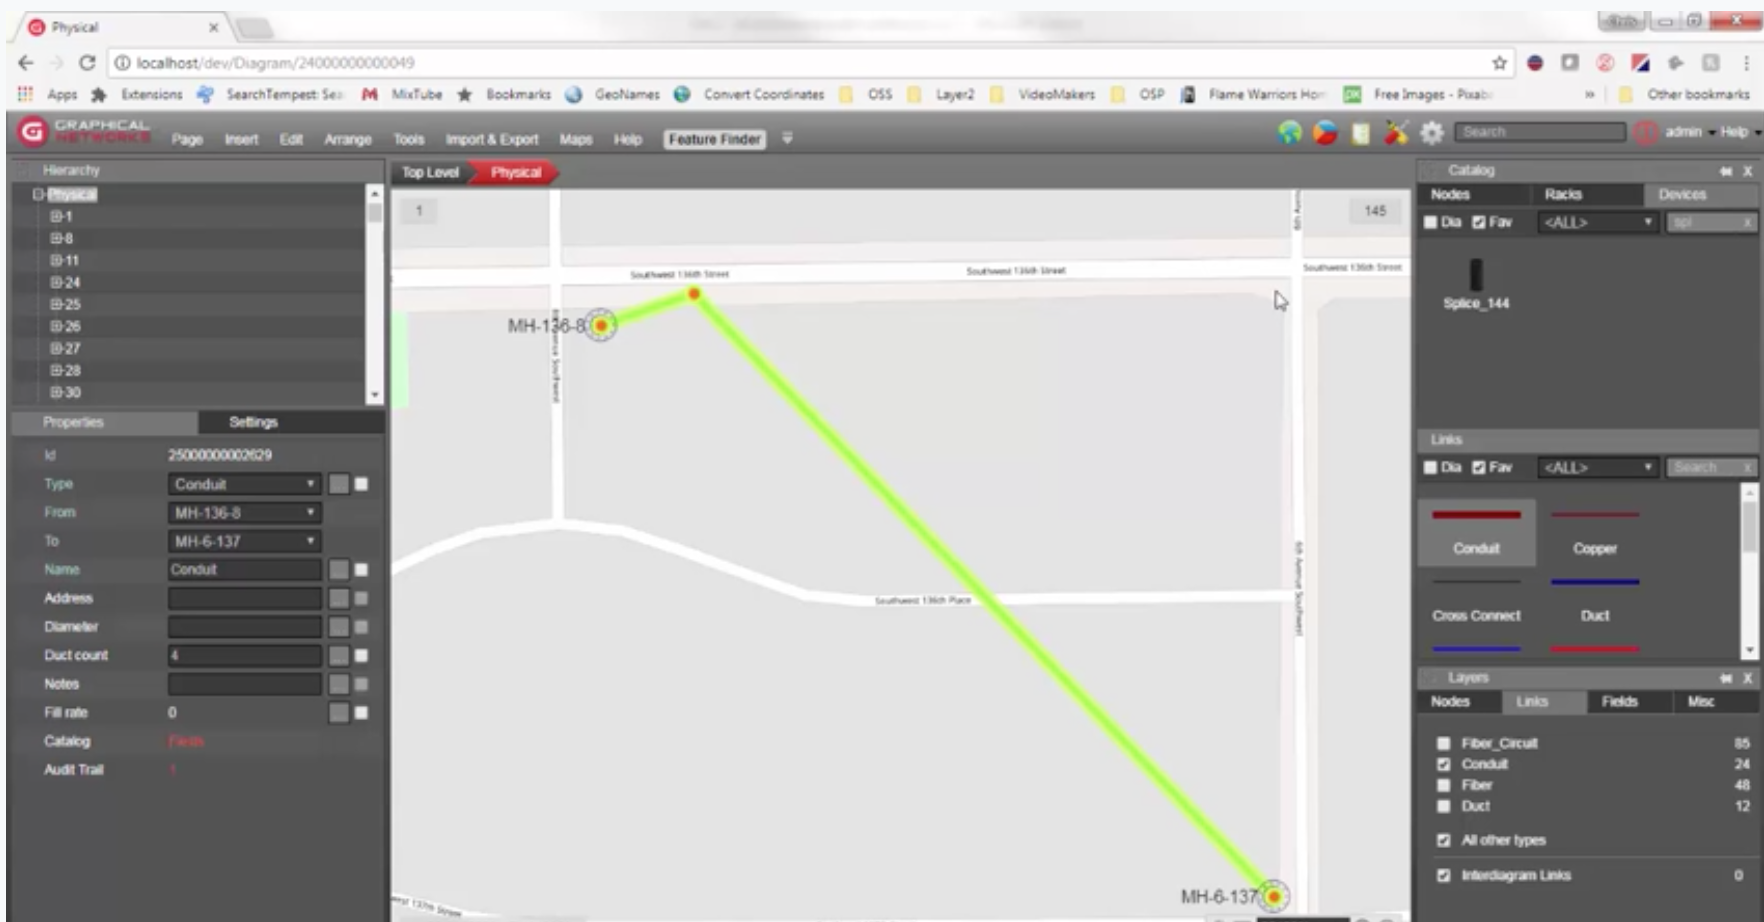
Creating a conduit between two manholes is simple: just drag and drop. Below, you can see what the conduit looks like when it joins two manholes using the shortest path. Note: this is not what it would look like in real life.
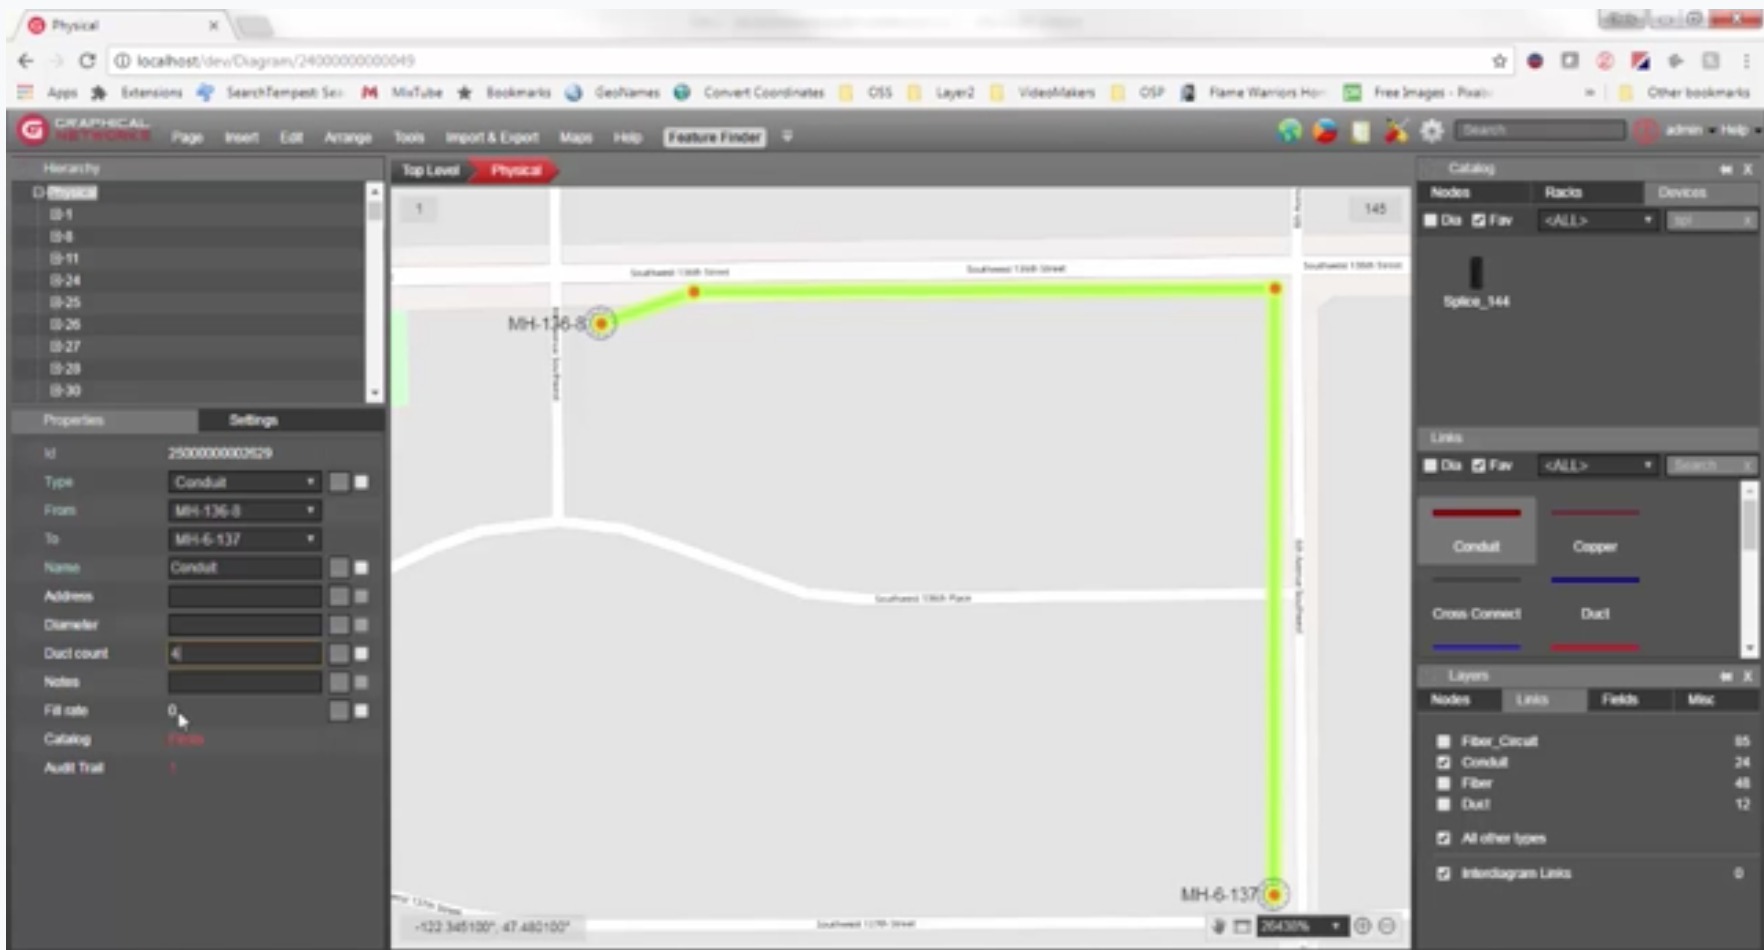
In real life, you would probably somehow reroute it. How do you do that? Using bendpoints. The bendpoints really are just what they sound like: points that bend the conduit line. It’s simple to create them: just select the conduit and add them with a very simple shortcut. These bendpoints are not actual objects- they simply will bend the line (watch video and skip ahead to 6:00 minutes in).
Adding Properties to Manholes
What properties can you have for manholes? To edit property values, click on the manhole itself: you can then edit the values (on the left side). The properties can be anything you would like to track. If you are the catalog manager, you can create as many properties as you want — and you can even import the properties from an existing data structure (the same is true for conduits).
In this example, the conduits have an address, diameter, and duct count. As a catalog manager, you can go ahead and add more properties by going to the catalog(adding them takes a few seconds).
The duct count here is already prefilled with a number 4: this is the default value. What does this number mean? You can add 4 ducts inside the conduit. While netTerrain will not restrict you from adding more ducts, you can set up rules so you get alerted when someone adds more (and through the API, you can set up restrictions, i.e: you can’t bundle more than 4 ducts inside this conduit).
Look at the lower left corner of the above image and you’ll see a property that does not seem to be editable. This is the ‘fill rate’. It’s calculated automatically using a function: the function counts the number of ducts the conduit has bundled divided by the number of count we have for the duct count. This gives you the ‘fill rate percentage’.
When you start adding ducts to the conduit, this percentage will automatically change.
Creating Ducts
How do you create ducts? With the conduit already selected, it’s actually pretty simple. netTerrain has a ‘cable mapper’: it’s one of many different ways to create cables between objects. To see the cable mapper in the video, you can skip ahead to 8:20 minutes in.
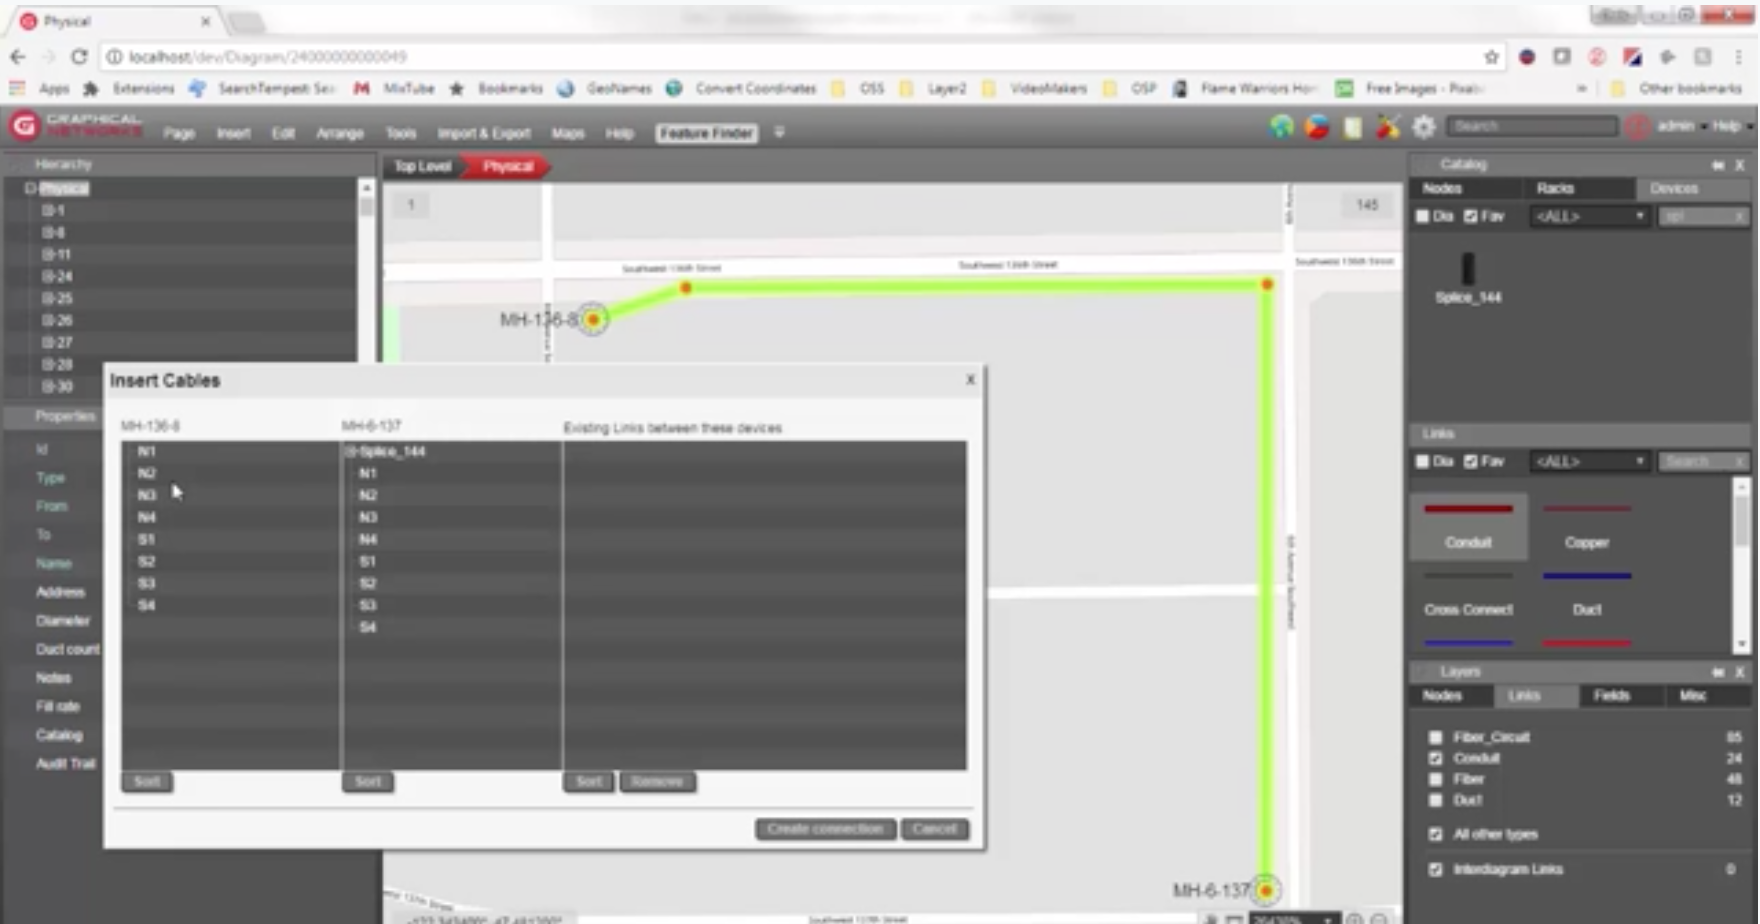
In the above image, the cable mapper is showing me, on one side manhole ‘136-8’ and ‘136-7’ on the right side.
We’re going to take advantage of the duct connection points, which you saw on the butterfly diagram, and link 4 on the left with 4 on the right side. We’re going to create connections using ducts — and bundle it, automatically, with the conduit.
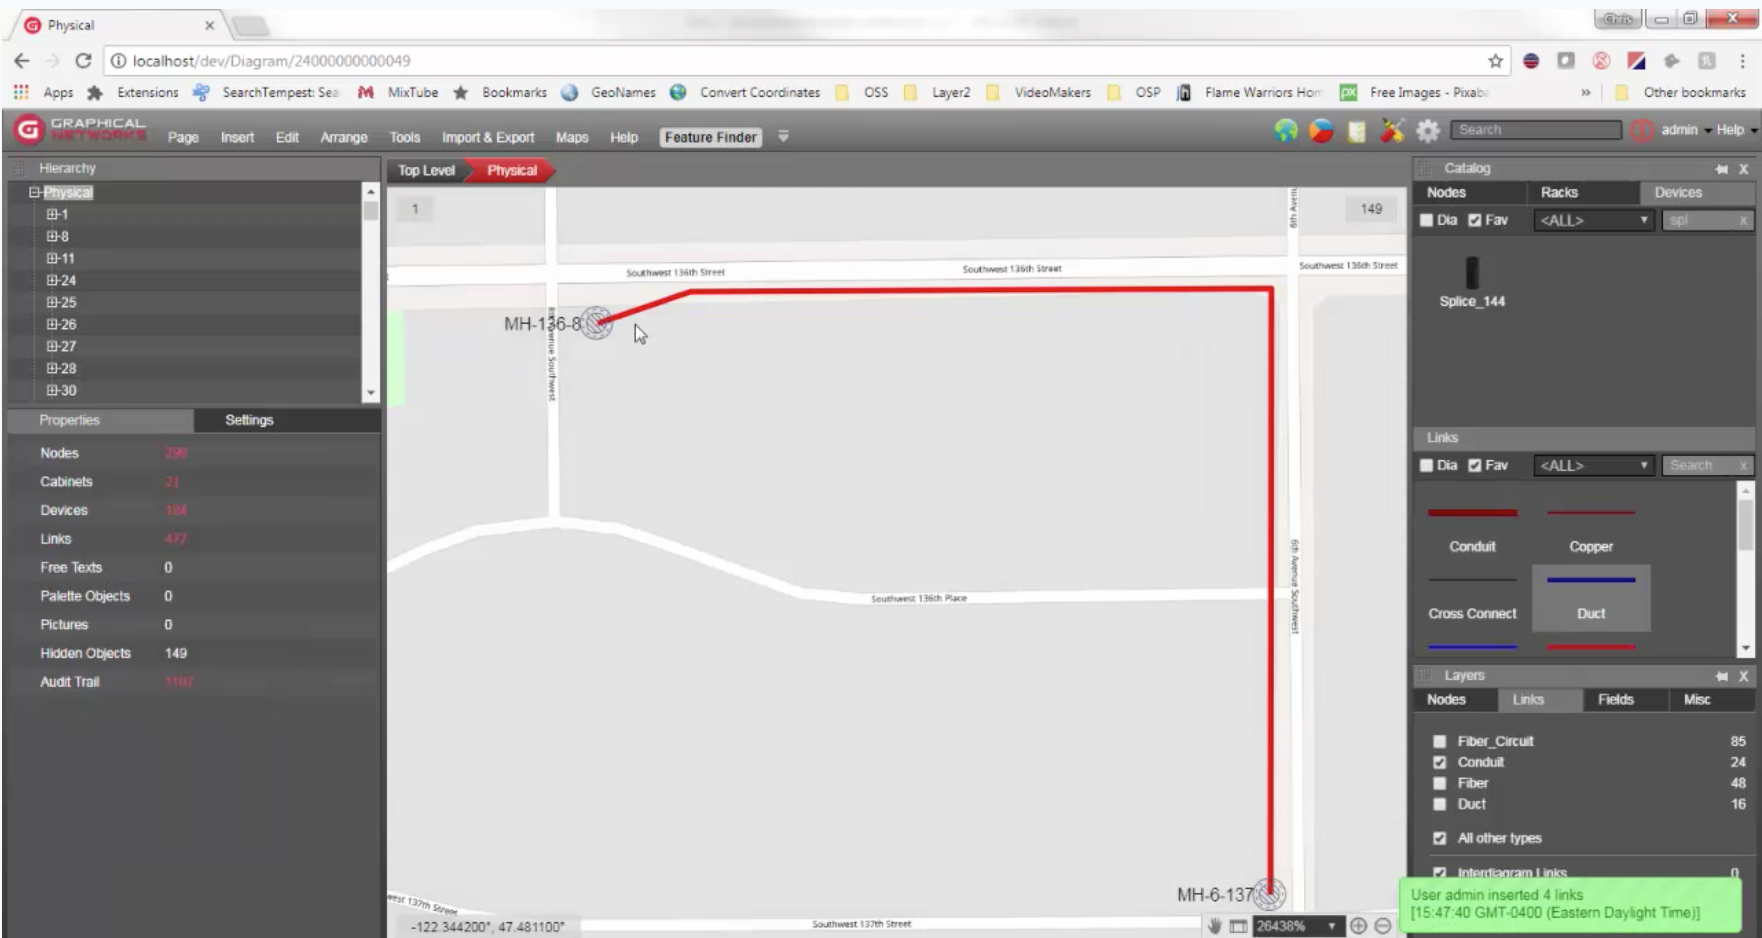
When full, the conduit changes colors automatically. Below, you can see that it’s now red because it’s full (you can see this happen 9:10 minutes into the video). Click on the conduit and you’ll see that the fill rate is now at 100. You can also see we have 4 bundled links — in this case links are ducts themselves.
Click on the number 4 next to the ‘bundled links’ and you’ll get a list of all the ducts that are associated or bundled (associated and bundled are just different words for the same concept) with a conduit. Whenever you look at a list view of links associated with another link (here you’re seeing ducts associated with a conduit), you can see the starting point and the ending points.
In the image below, all the ducts start at manhole MH-136-8 — and end at manhole MH-6-137 — and all the corresponding positions.

Under ‘link’ across the top, you can click on ‘show on diagram’ and it will take you to the starting point of the duct (see 9:30 in the video).
It takes you inside of the manhole and you see inside of the butterfly diagram that specific duct that I just clicked on.
Up to this point in our series, we’ve covered how to create dynamic outside plant maps in netTerrain and how to place different types of objects on the map. In the next installment, you will learn how to map fiber inside of splice boxes.
Stay tuned — and happy documenting!