In one of my previous articles — about what netTerrain is — I discussed some of the items you can visualize in netTerrain. When doing demos for prospects, most people don’t know the full capabilities of our IT visualization software, netTerrain. It’s more than just a network documentation, DCIM, and fiber plant solution…it’s a web-based visualization software application — and it’s an example of the capabilities of IT visualization software.
A quick side note: some of our competitors say that netTerrain is ‘just an Outside Plant tool’ or ‘just a DCIM tool’: this is not at all accurate. netTerrain is a web-based, visual documentation tool to document anything that you may want to see!
netTerrain diagram graphics are embedded with data. By embedding objects (nodes, racks, devices, connections) with user-defined data, netTerrain arms you with real information about your systems. With a central repository that contains information about all objects in netTerrain, it’s easy to manage, troubleshoot, answer questions, plan, and help make informed decisions. Add any attributes/fields for any object or link, the flexibility to create your own hierarchical drill-down diagrams, and connections to easily see the relationships of objects and its connections.
Below are some of the frequently asked questions I answer when talking to prospective customers about how our IT visualization software (netTerrain) can help them:
“Is it easy to understand the relationships of these diagrams?”
netTerrain lets you see and understand system-wide relationships. Computer networks, enterprise models and assets don’t exist on flat pages; neither should your documentation. netTerrain’s mission is to store and present information graphically and hierarchically, so connections between objects are tracked as carefully as the objects themselves.
What does this mean for you?
- Examine a global view of your corporate network and drill down in seconds through a region, a site, a building, a floor, a wiring closet, down to a single port.
- Select two objects in distant diagrams and see, on the fly, how they are connected.
Because the entire project’s data is maintained in a central repository, it takes just seconds to go from the top of the hierarchy down to the smallest room, function, or port.
“It’s hard to find information scattered with spreadsheets and multiple Visio diagrams. Is it easy to find information in netTerrain?”
Because netTerrain has a database of your information, you can perform data searches across some or all of the diagrams in netTerrain. You can print out the search-result table, export the search result tables to .CSV, or see each record in a diagram view.
“That’s great you have these nice, pretty diagrams, but…can I see the data in a tabular spreadsheet type view?”
Yes, you can. With netTerrain, you can view your data in a Diagram View and a Table View. You can switch instantly from Diagram View to Table View and the table views are easily exported to .CSV format to view tables in spreadsheet format.
“What are some other use cases that you can do in netTerrain, besides network mapping, DCIM, and OSP?”
- Office space (…not the movie!)
- Enterprise architecture diagrams
- Workflows
- Virtual infrastructure
- Cloud Infrastructure
“…Office floor space?”
Sure!
Easily import your office floor plans or use the netTerrain’s grid map to position objects neatly. Show rooms, devices connected to wall jacks, and phones for E911. You can also show them terminate inside telecom rooms and showing connections to data center rooms.
 Office Floor space
“What about other types of visualization?”
Use netTerrain for Enterprise Architecture diagrams! In addition to documenting networks, organizations can utilize netTerrain’s visualization capabilities to diagram and document other areas such as Enterprise Architecture, DoDAF, C4ISR views, workflows, and other general-purpose drawings. With high level graphic depiction of current environments, in a central repository, enterprise diagrams allow for instant decision making in all mission critical situations.
 DoDAF views, Example 1
 DoDAF views, Example 2
“How about my virtual infrastructure?”
You bet!
Manage your virtualization and with netTerrain with ease with an Adapter/Integration of VMWare vCenter/vSphere/vMotion. Visually see your VM inventory to determine how many virtual machines you have, where they are, what they’re doing, and who owns them. Additionally, for organizations using VM Ware NSX-T, you can easily pull information into netTerrain with its connector.
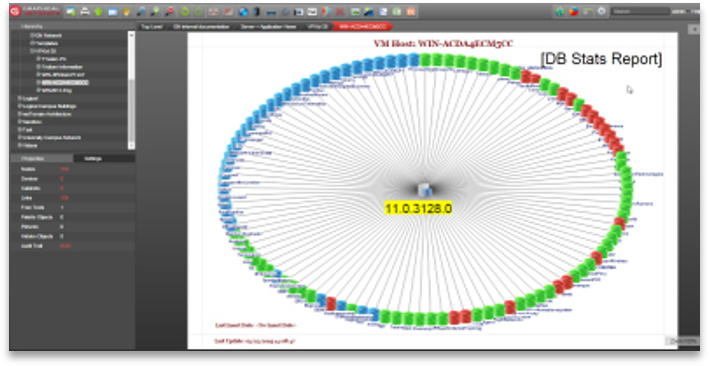 VM Host Images
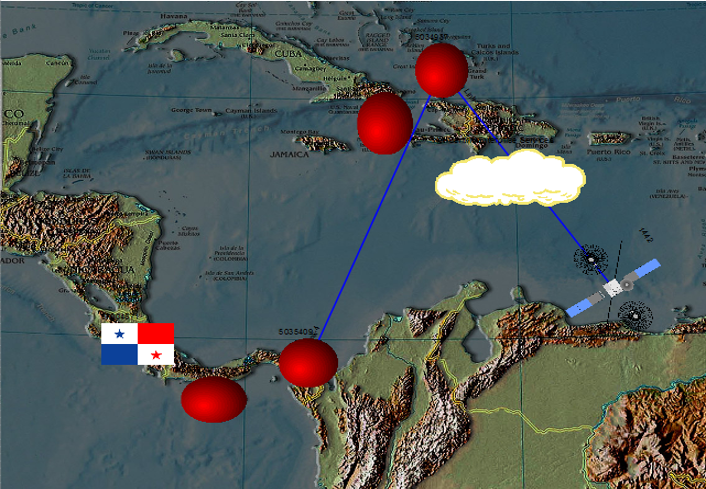
“…Cloud, too?”
Sure. With netTerrain’s connector to Azure and AWS to save time, automated live cloud diagrams, obtain a live inventory list, and search across all of your entire computing resources!
To sum up, the possibilities in IT visualization software are endless. Our IT visualization software netTerrain can help you with network topology maps, data center assets, cabling, racks, fiber plant and the other use cases above. In fact, you can do so much with IT visualization software that, this year, we are rolling out a contest to see who can create the best looking ‘artistic’ network diagrams!