 In this blog on automatic calculations (using our DCIM, outside plant, and network diagramming software), we’ll review what we call ‘expressions’ in netTerrain. Expressions are functions you can create in netTerrain using transact SQL to compute or aggregate any sort of scale or value — and retrieve it in a property.
You may want to click on a specific object such as a node or a link and then display something in one of the properties (as you know you can create your own custom properties in netTerrain) based on a calculation. This calculation can be anything: a sum of certain elements, a count of some of the values for elements of a specific type, or any sort of convoluted calculation involving anything that is permitted as legal in transact SQL.
At any time throughout the blog, you can watch the video by clicking here.
Overview of Expressions: DCIM, OSP, & Network Mapping Calculations
How do these expressions work?
They’re calculated on the server side: the netTerrain server has a folder of expressions and it has a bunch of these functions already loaded. These are functions that Graphical Networks ships with your product and they come built-in and pre-loaded.
You can create your own expressions in netTerrain — in addition to the built-in expressions. They can be used anywhere — from network documentation purposes where you need to dynamically show values on a diagram or for a node based on dynamic information (in other words, aggregate functions or calculations).
You can use expressions in DCIM and data center infrastructure management. You can show, for example, the average temperature of two racks on all devices that within them. You could also show the average available power per rack when the racks have two power strips. You can show the availability that you have on a cable tray using percentage (see below). You can also use expressions for outside plant purposes. Expressions in netTerrain can be applied in a myriad of ways.
Just to reiterate: we ship netTerrain with about 200 expressions (and you can create your own). You can also request these from Graphical Networks as part of the maintenance.
Fill Percentage Example: DCIM, OSP, & Network Mapping Calculations
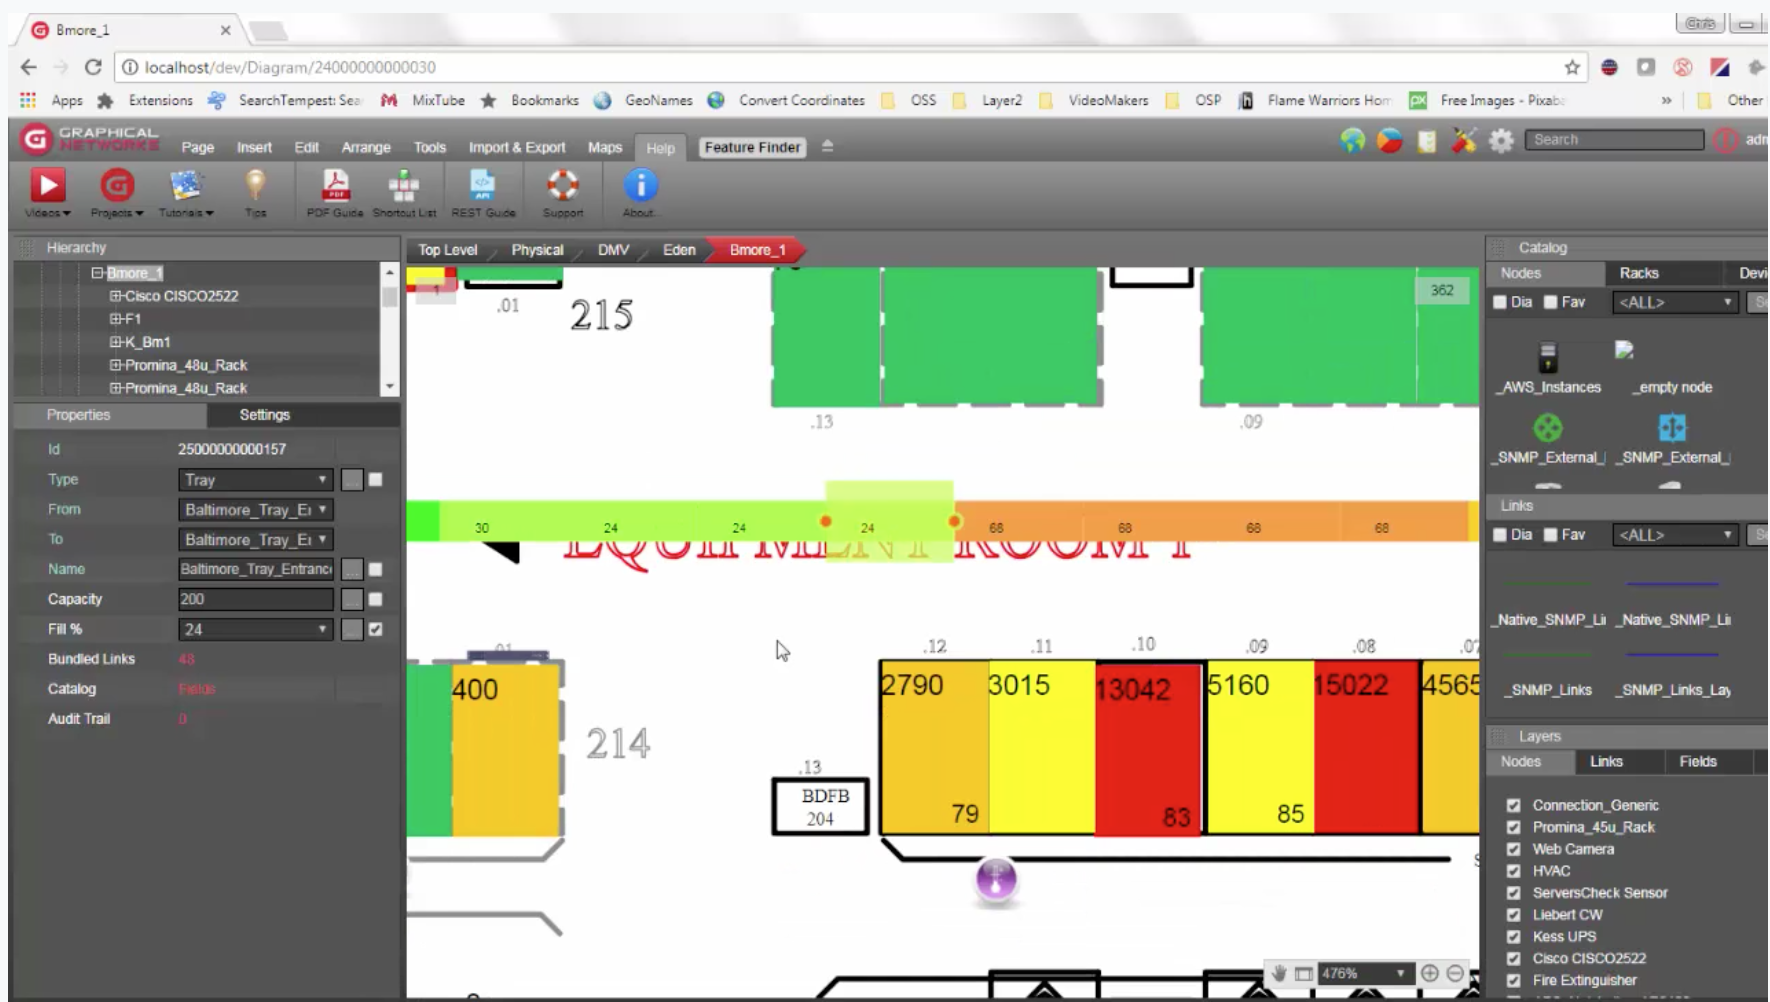
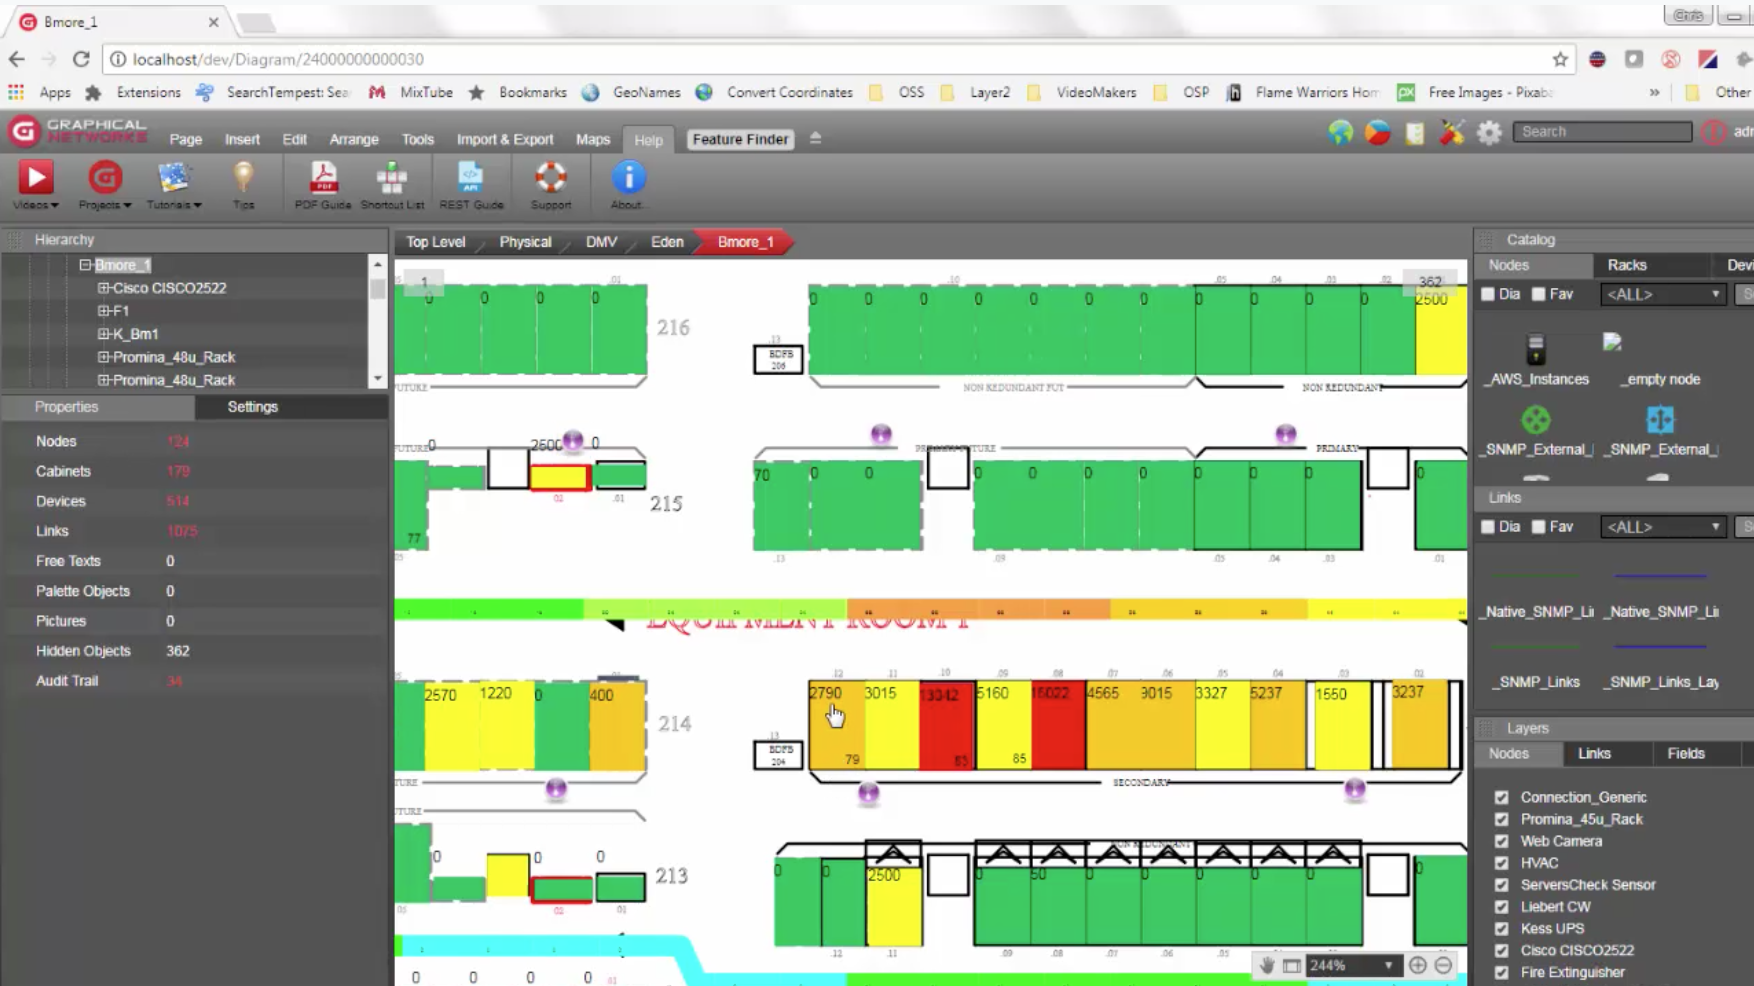
Let’s take a look deeper and see these expressions — and discover how they can be used. In the image below, you can see sections of a tray that are showing a number. As I mentioned earlier, this number is a fill percentage for that tray.
The fill percentage is an example of a specific expression built for a specific purpose. How is this expression calculated? This fill percentage is calculated based on the capacity of the tray — note that this can be a static or default value or can even come from a different source of data and the number of bundled links. We won’t dive into what bundled links are in this blog but suffice it to say bundled links are any cables or connections associated with the link that you are clicking on. You create a hierarchy of cables in netTerrain so you could associate cables with a tray.
The fill percentage is simply calculated as follows: the occupancy rate of the tray based on how many bundled links it has and its capacity. So: 48 bundled links divided by a capacity of 200 gives you a 24% fill rate.
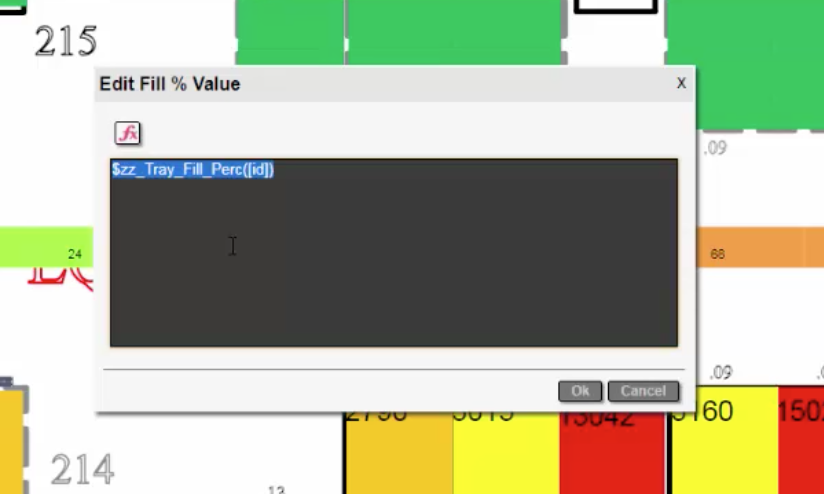
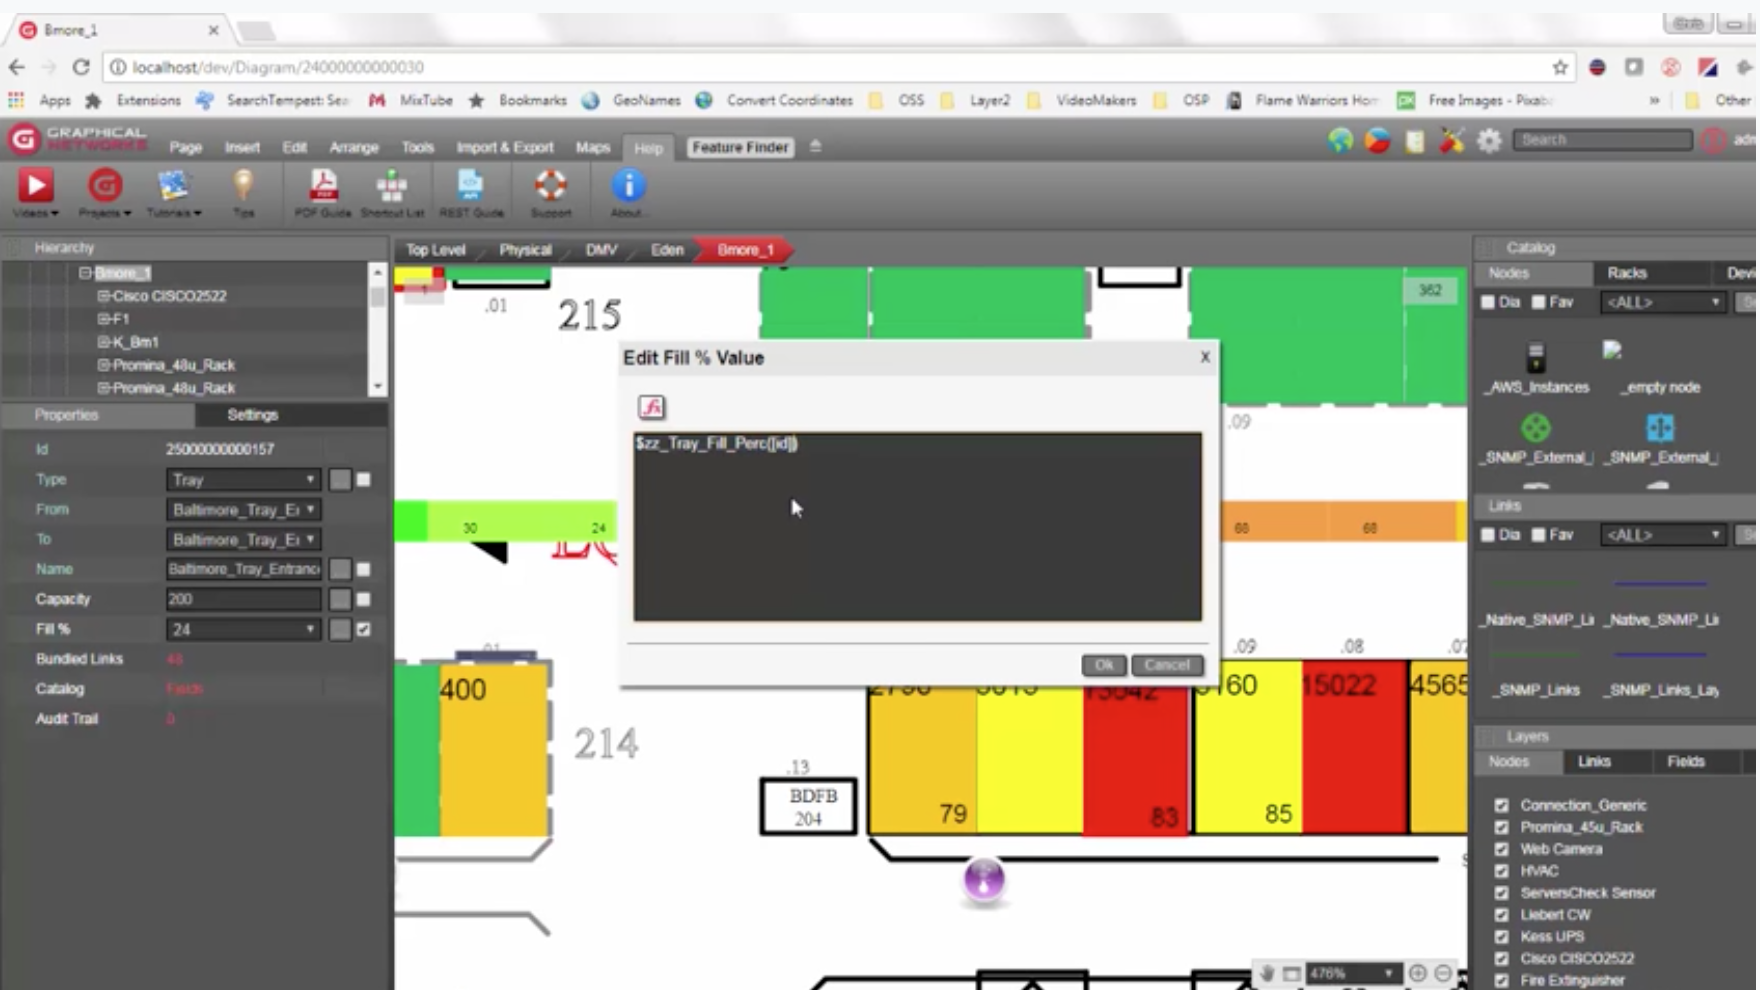
In this example, it is applied to this property’s fill percentage – which is a fill percentage that is created for this very purpose. If you were to click on the ellipses, you would actually see that the property isn’t 24 because it’s not a static value: it was dynamically generated by netTerrain on the fly as you click on that tray section. It’s calculated based on this function here: you can recognise this an expression because it starts with a dollar sign.
Where to Find Expressions: DCIM, OSP, & Network Mapping Calculations
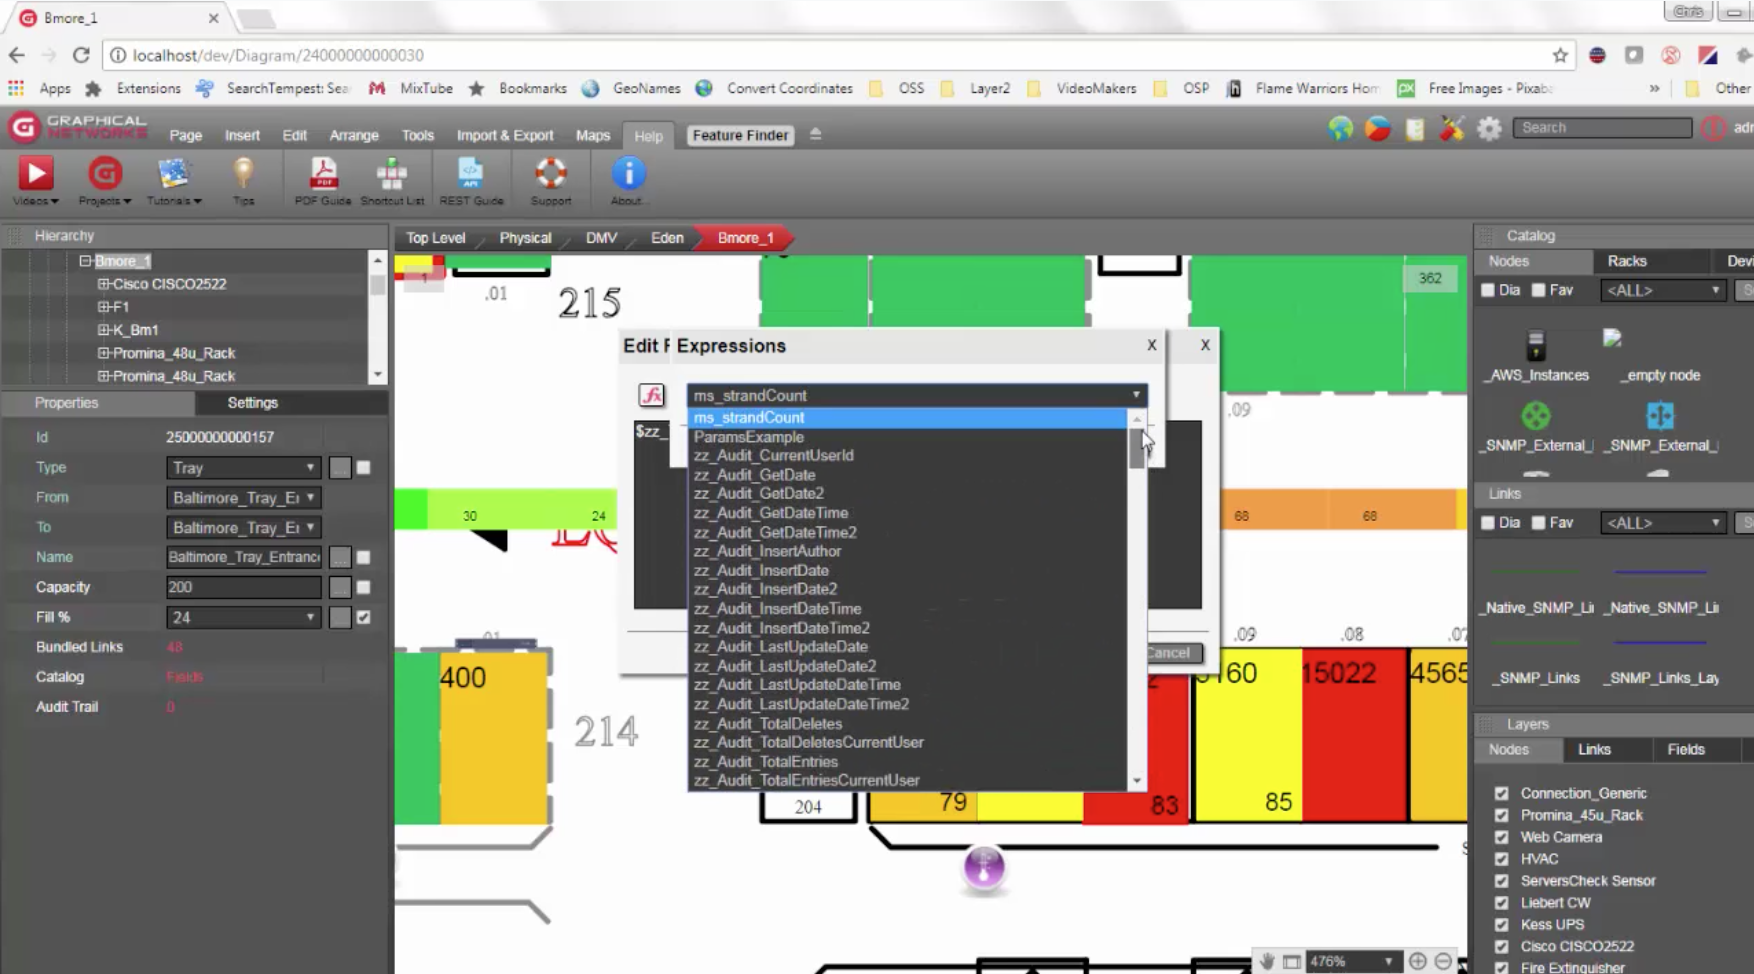
So, where are expressions stored? They are in the netTerrain server: as an end-user, you can retrieve them simply clicking on the FX button. In the image below, you can see we have hundreds of expressions included in netTerrain. They are displayed in a pop-up box for expressions. As you add new expressions, you will be able to find them in this box.
You can add your own expressions — and you can show these expressions as a property. You can use these properties to generate visual overrides. With visual overrides calculated from expressions, you can change things for the end-user: the color of the objects or the thickness, in this case or the style or the effects and blinking and so on. Visual overrides are also susceptible to changes in calculated values AKA expressions.
So far you’ve learned that you can calculate values such as power per rack, this is not the only place you can use expressions: you can also use them in free text.
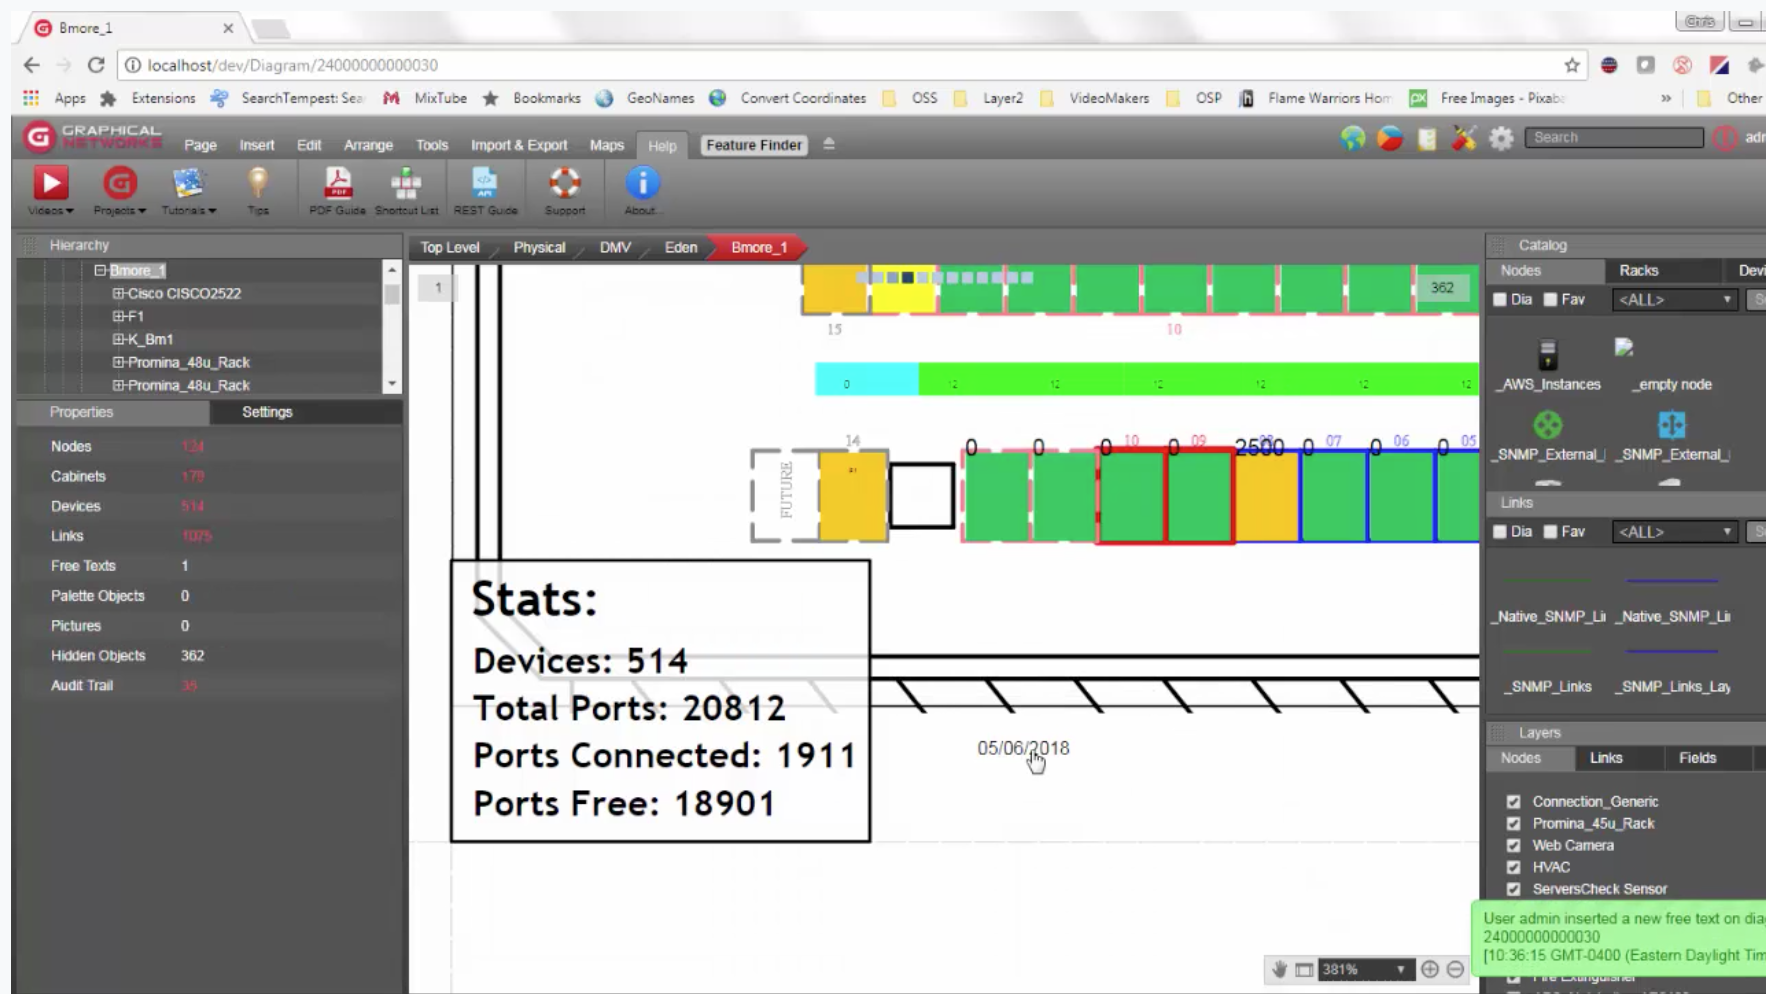
Just bring in a free text and make an expression. Get today’s date, for example.
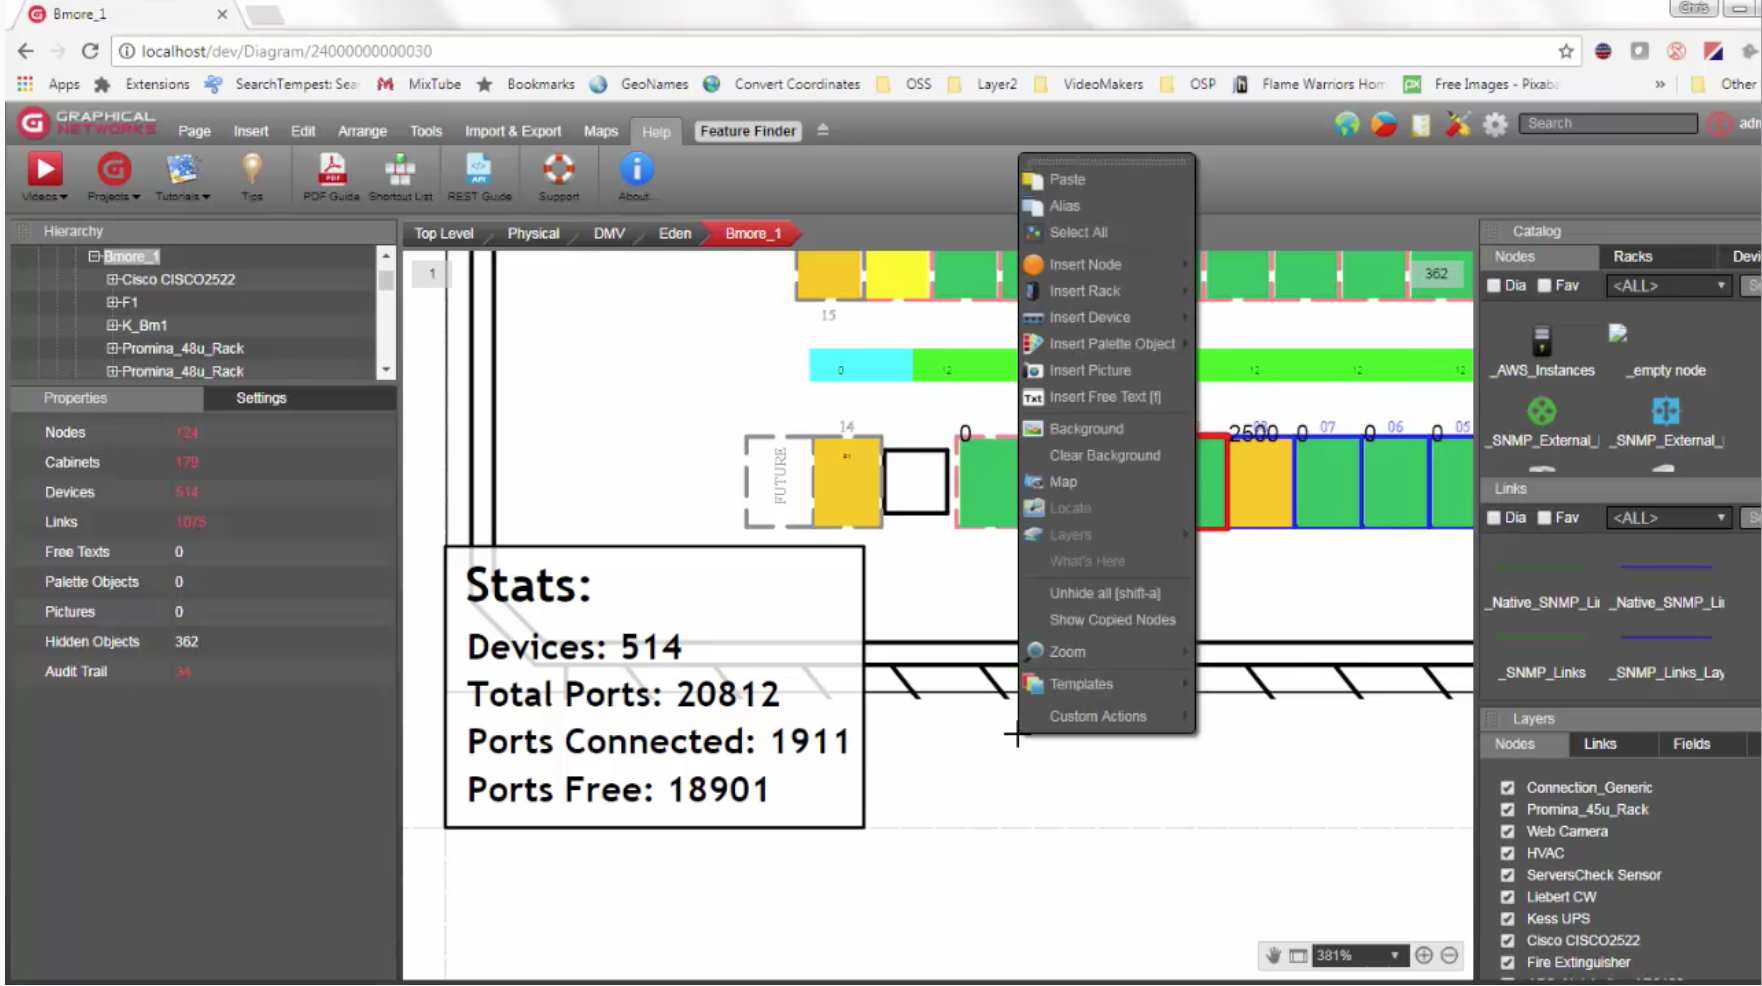
Displaying today’s date is an expression: it’s displayed as a free text in netTerrain.
Build Your Own Expression: DCIM, OSP, & Network Mapping Calculations
Let’s build our own expression.
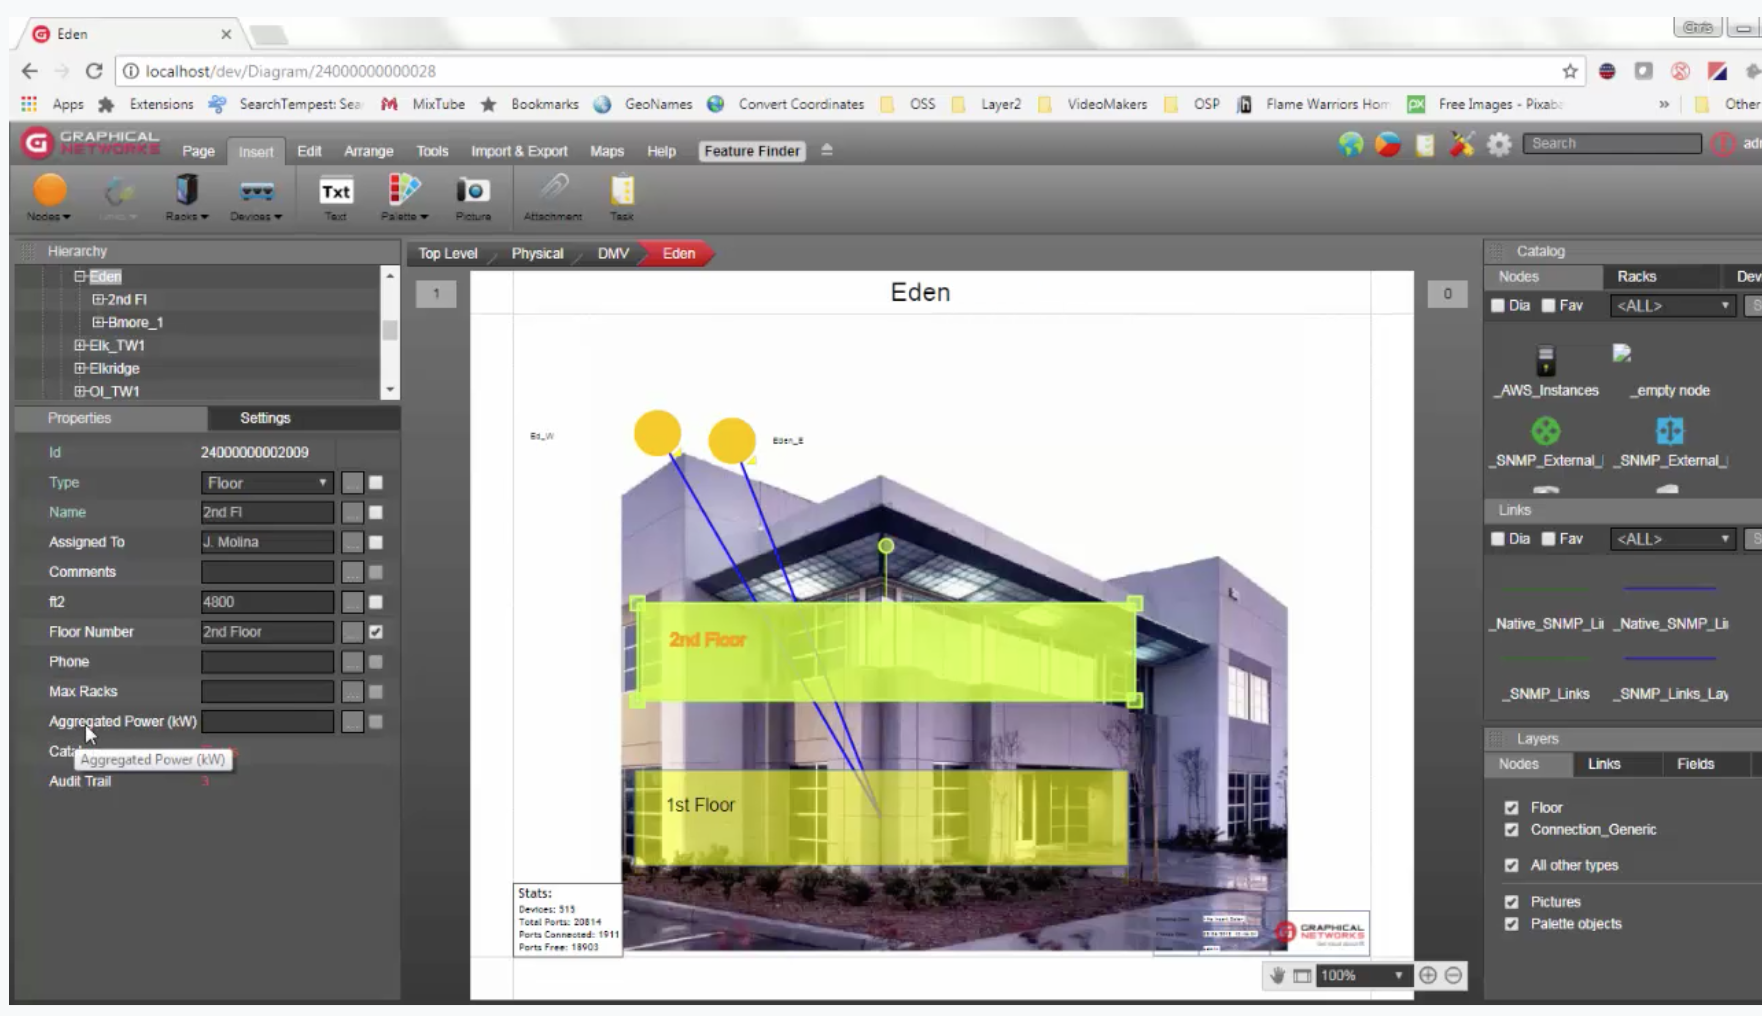
For the sake of example, let’s assume you’d like an expression that calculates the total power used underneath the first floor in the image you see below. From a DCIM perspective, this is pretty interesting: you can obtain aggregated power readings by simply clicking on the first floo and this is calculated dynamically based on what you have underneath.
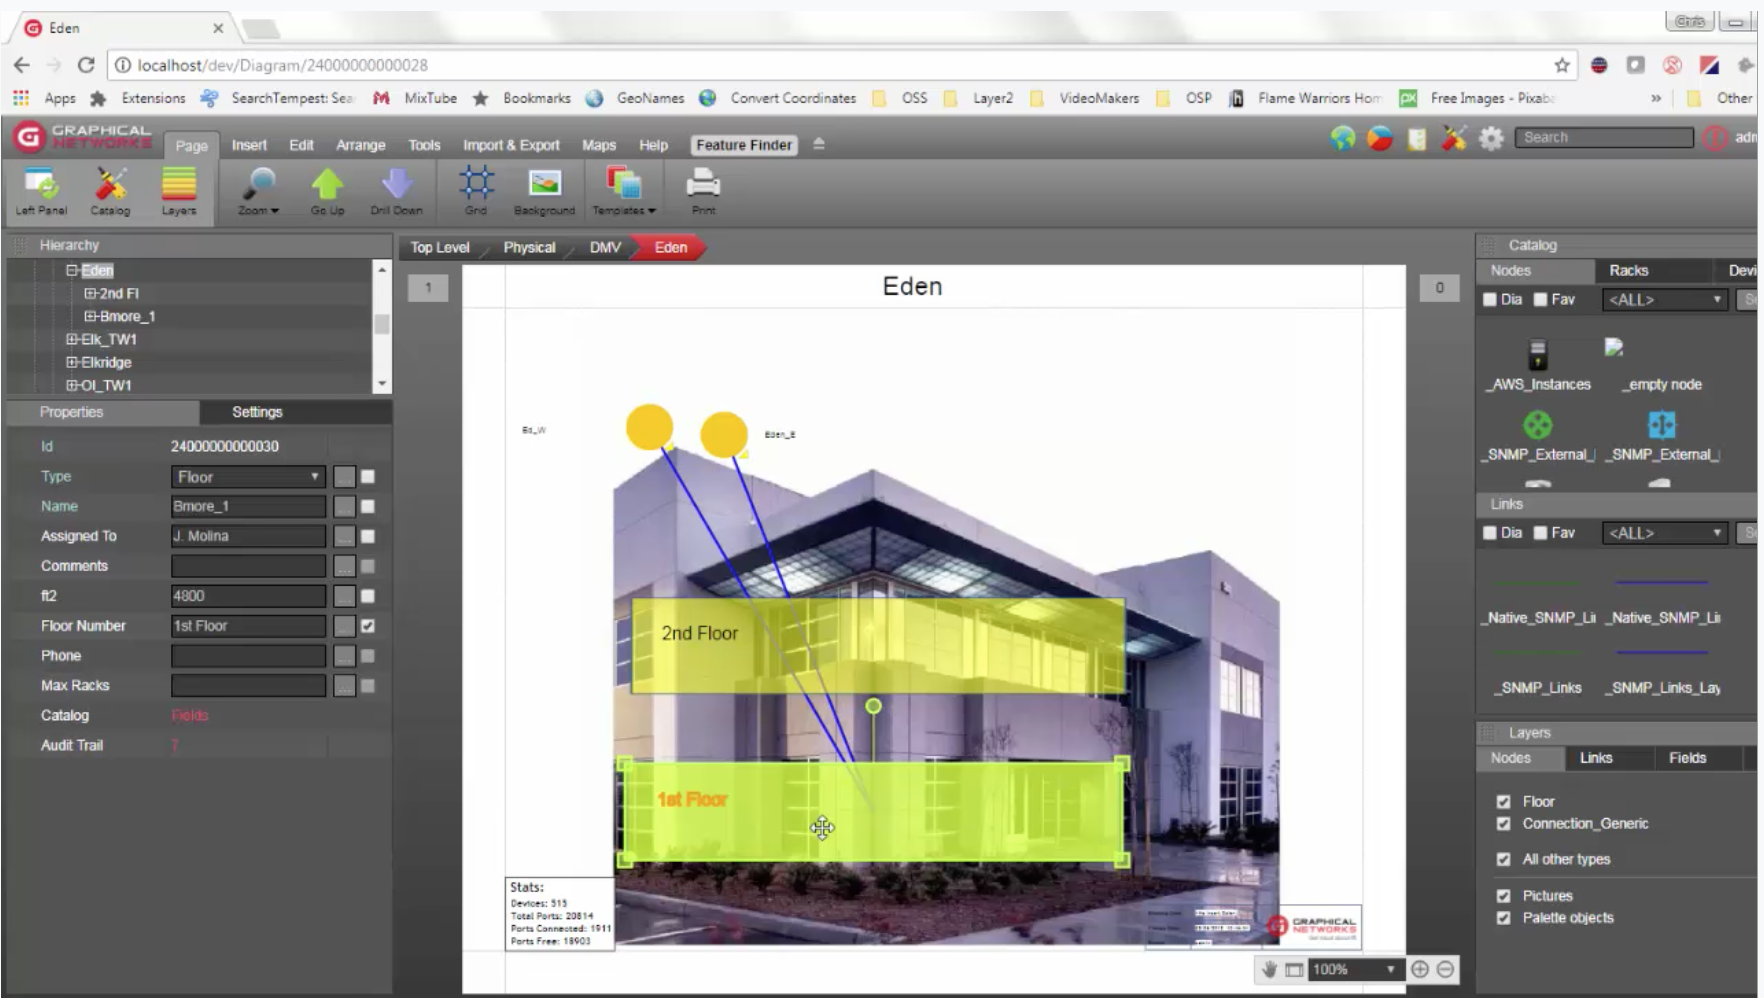
Obviously, this is just an example of power management and environmental power monitoring in the DCIM context, but it serves as a good example. So, how do we make this happen?
First, we’ll create a new custom feed from all the floors here. We’ll call it “aggregated power (KW)”.
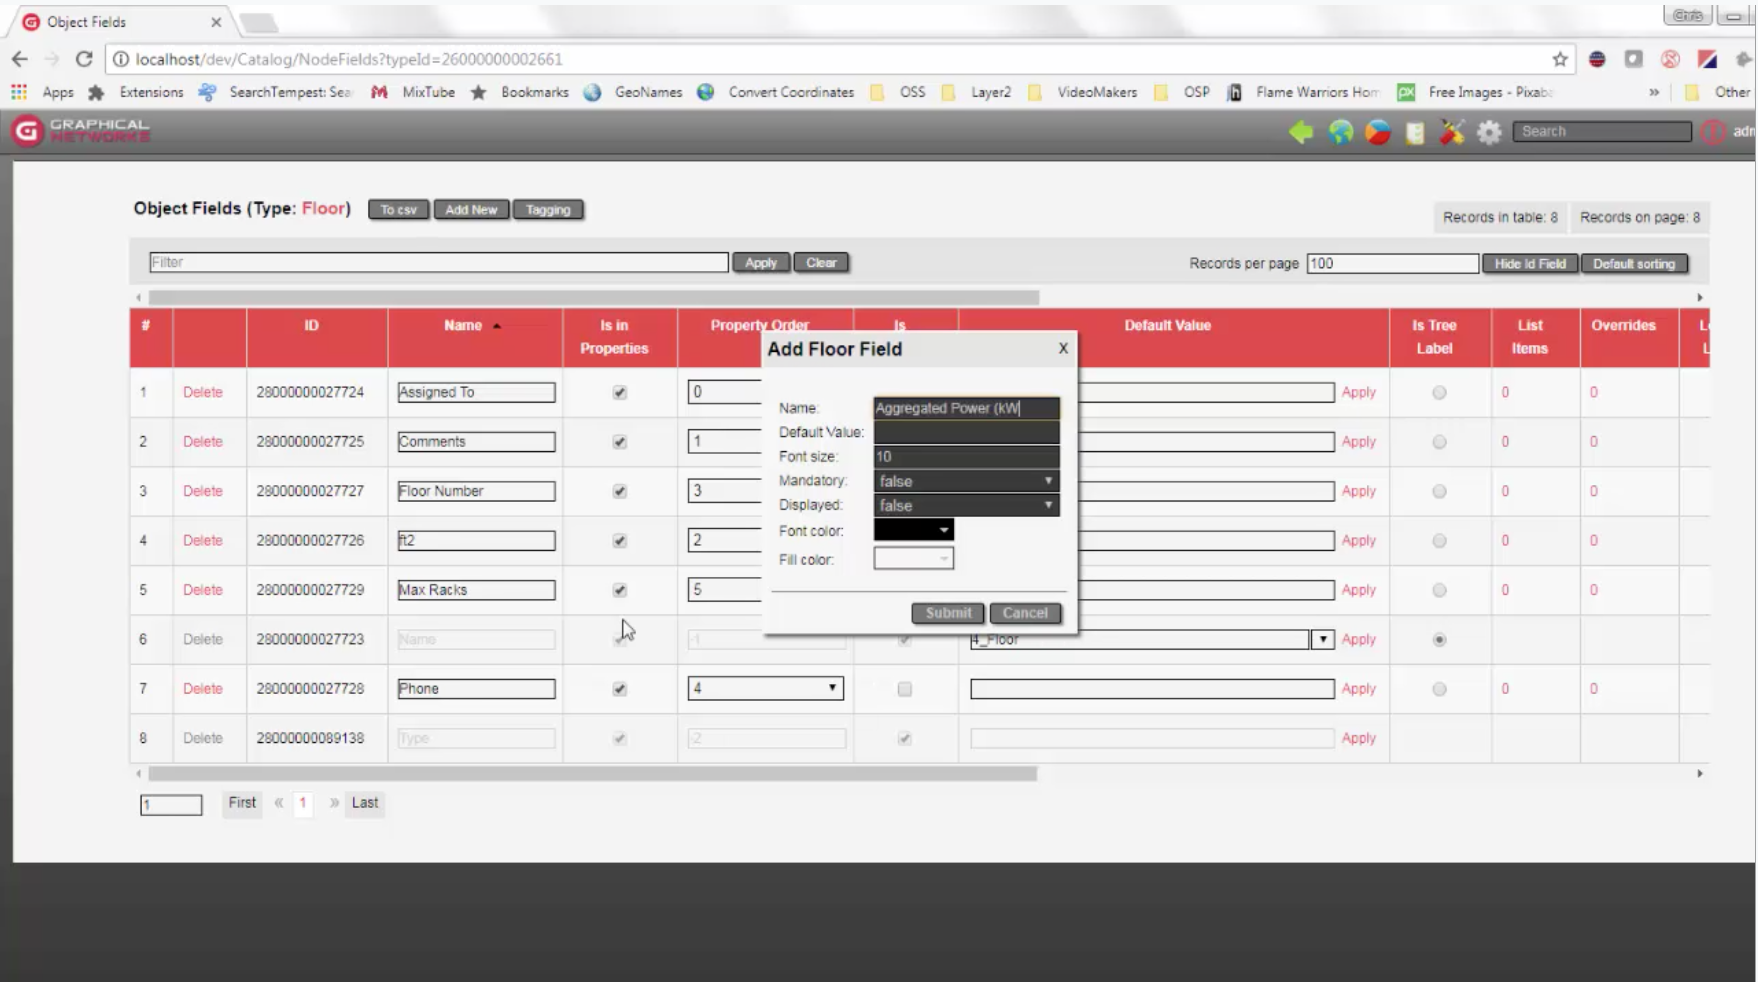
Apply the changes and go back to the project. Now, every floor in your netTerrain project will have this aggregated power feed.
Right now, this isn’t very useful right now — because it is empty. So, let’s apply these expressions. But first, we have to create them. How do you do that?
Expressions live inside of the netTerrain server.
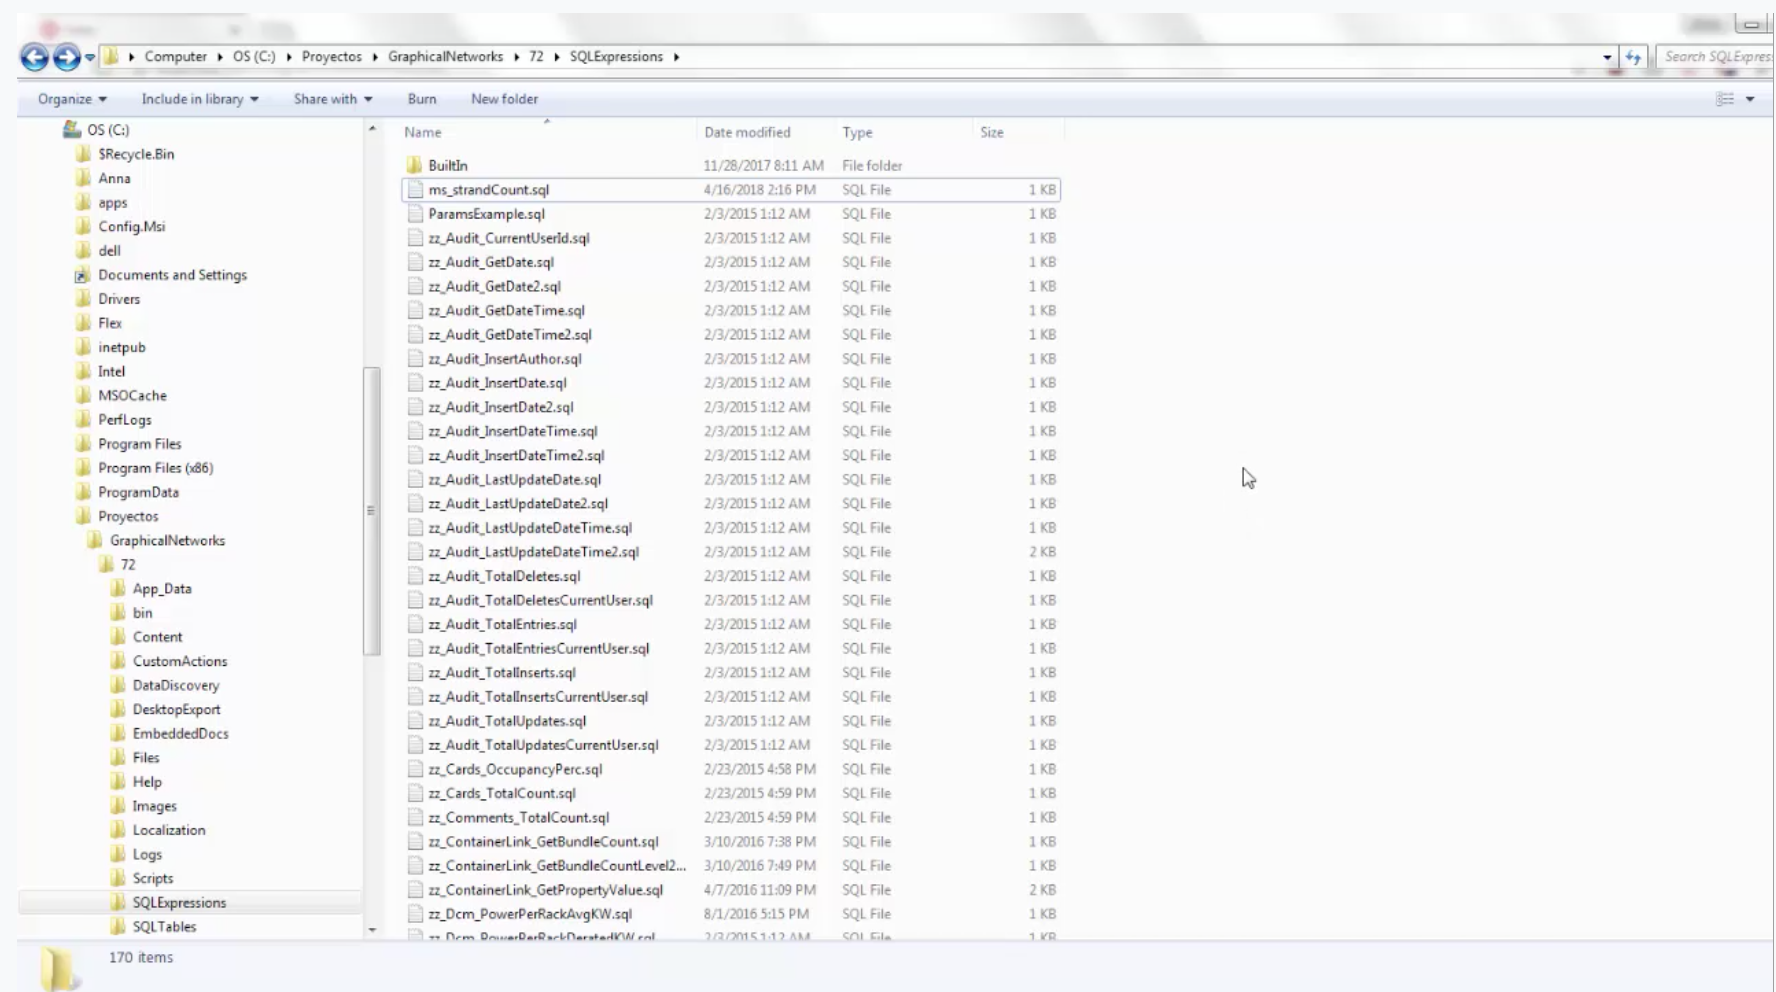
So, right now, I’m in the server — and I can see there is a folder here called ‘SQL expressions’ – right under the netTerrain install path.
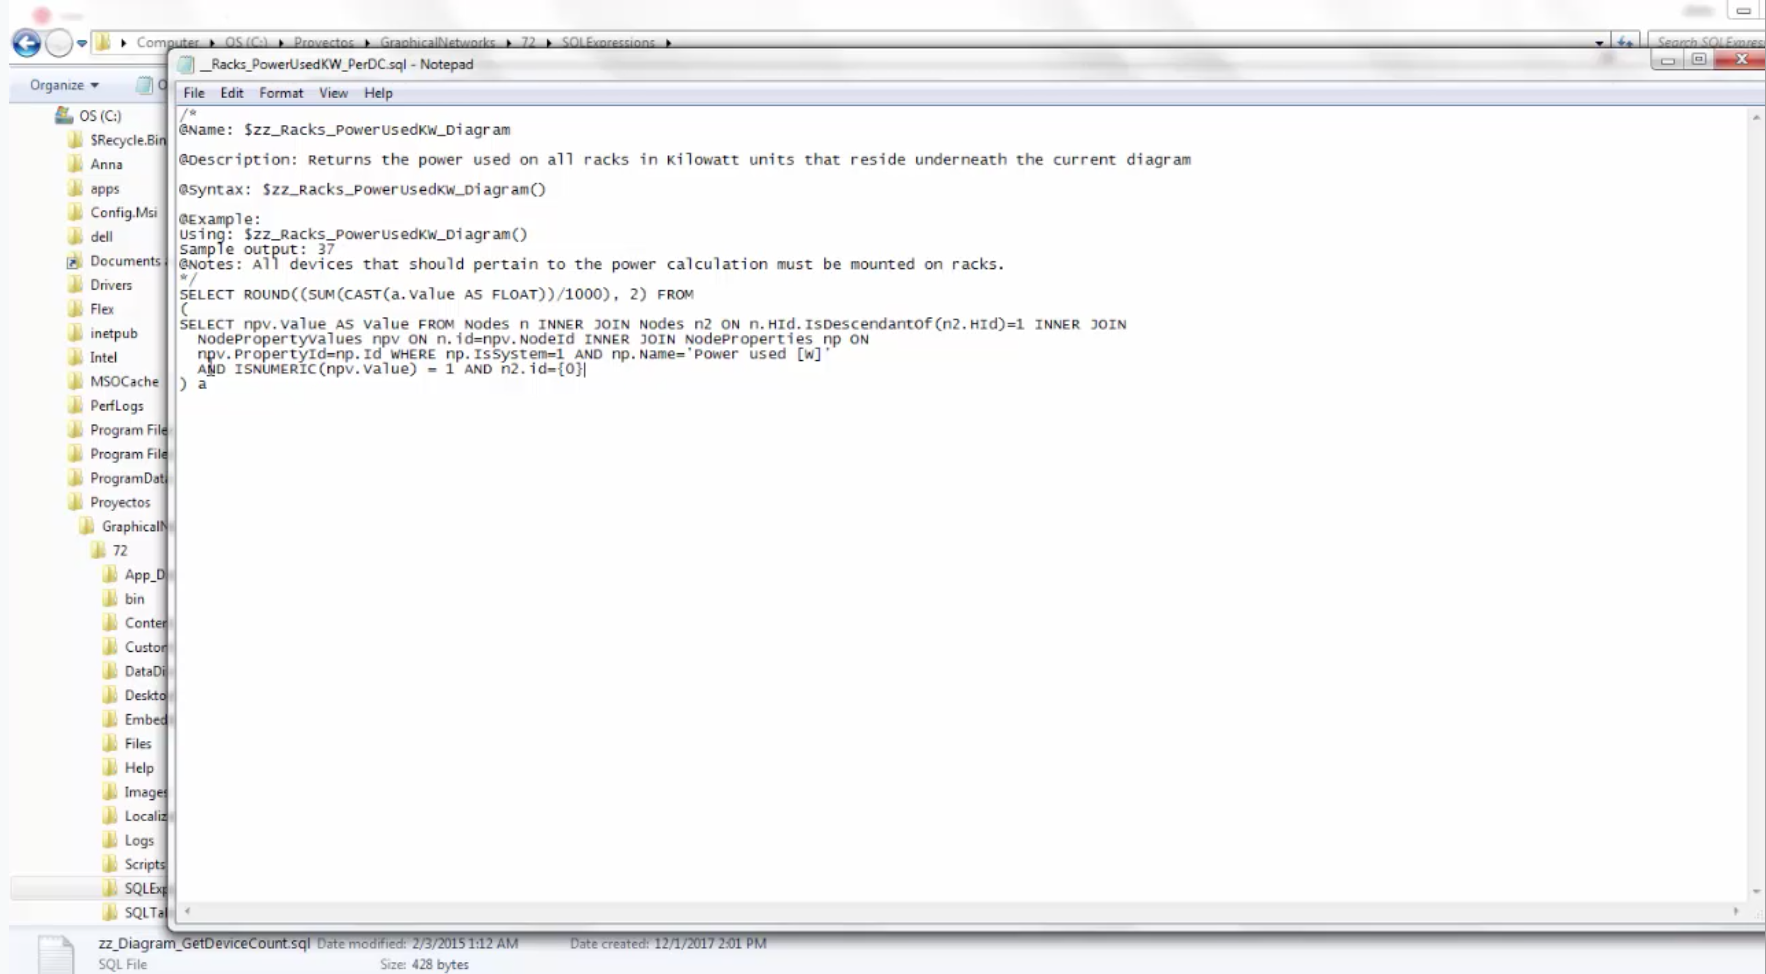
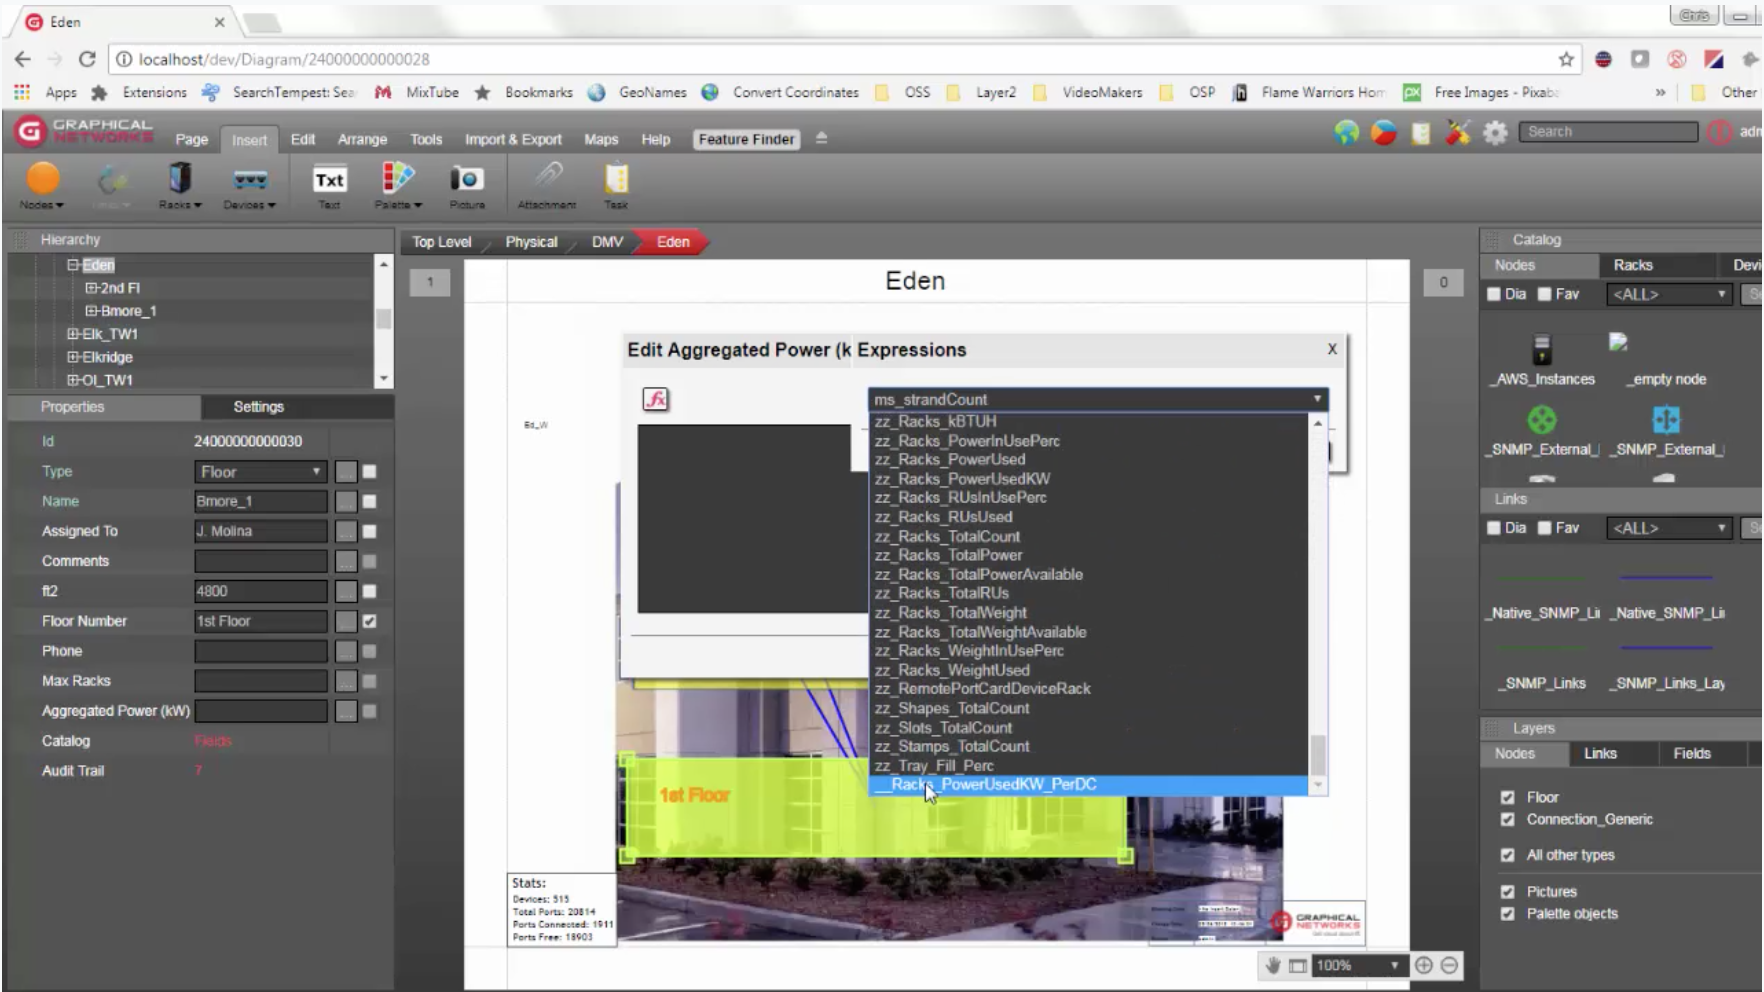
Double-click and you have a bunch of these expressions: let’s open up the expression I just created for calculating or returning the power used on all racks/kw/units that reside underneath the current diagram. With this expression, clicking on the floor will return all of the used power kw from all devices that are rack-mounted inside that specific floor. We have to pass the floor as a parameter. Without going into the details of the SQL, you can see below that there is a way to pass parameters here inside these expressions using this bracket notation.
The rest of the SQL is fairly straightforward: it gives me the sum formula in a certain way, for all the values for the property, used power, for object racks that are descendents of the node that I’m going to click on.
Save this — and you can name it anything you want but it has to be an SQL file, though.
Now that it’s saved, click on the first floor and click on the ellipsis button.
Voila! We’ve got the racks/power used per KW per data center. The parameter is going to be the ID of the floor – that’s what you are clicking on.
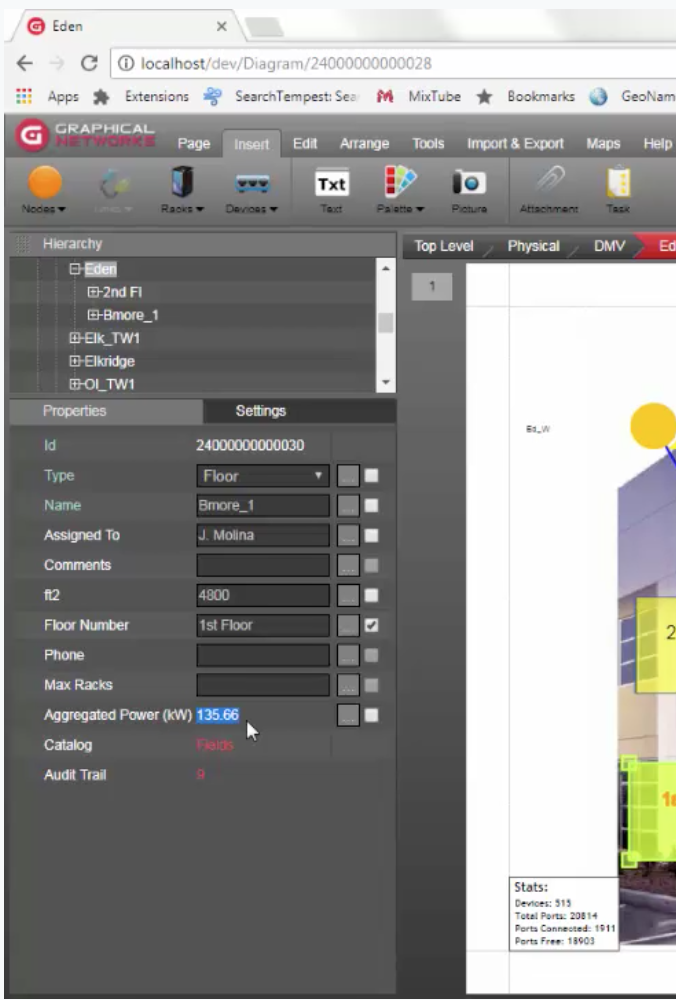
You can now see the computation. It’s as simple as that.
In conclusion: hopefully, this blog (and video) have been useful in giving you a basic understanding of how you can propagate aggregated or calculated values in netTerrain for any property or any free text or any template — dynamically — just by simply clicking translate SQL to create these functions on the server side.