
May I have your attention – system integrators and government agencies? Massive amounts of data can be difficult to disseminate in a crisis and yet decisions need to be based on fact for mission critical objectives. If you need to visualize data as part of a project, IT visualization software such as netTerrain can help.
Visualization software can help you to:
- Visualize complex data and supplement traditional management tools
- Create as-built pictures of your environment
- Reduce time spent on searching for information
- Be compliant with regulatory compliance acts
As an example (and because we’re a bit biased) we’ll use our software netTerrain to highlight how IT visualization software helps system integrators and government agencies tackle data visualization in projects.
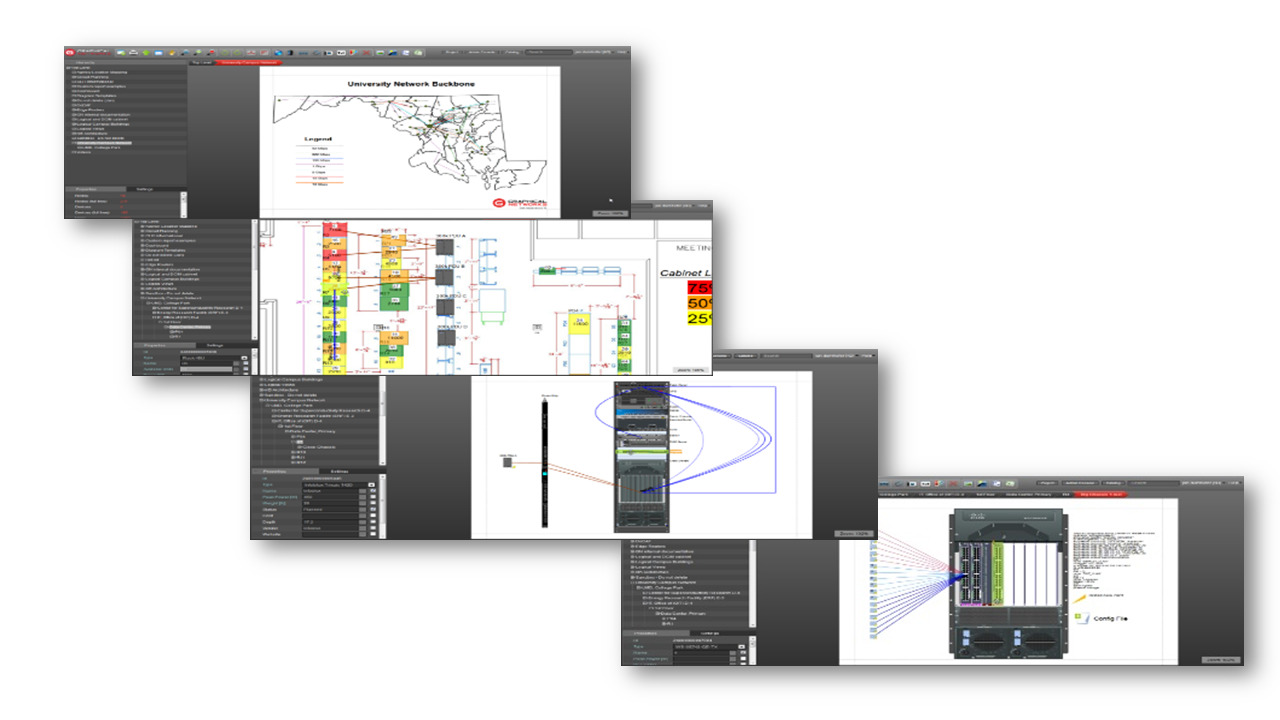
Whether you are looking at documenting a network, locating assets in data centers or the fiber plant, tracking the complete infrastructure of a project, or real time data integration, netTerrain can help. High level graphic depictions of current environments, in a central repository, are essential for instant decision making across mission-critical situations.
netTerrain is a web-based visualization program that offers both on-premises and Cloud license options. It does not need to be internet-facing (important for many of our government customers). netTerrain requires a Windows Server and a MS SQL Server license — if installing netTerrain on-premises. With a centralized repository, it’s easy to share information, assign permissions, and bring in colleagues to view and edit the diagrams.
You can:
- Create hierarchical web-based diagrams
- Collaborate and annotate with colleagues
- Embed unlimited data with all objects
- Drill down to the details of any objects
Data-embedded graphics
By embedding objects with user-defined data, netTerrain arms you with real information about your systems. With a central repository that contains information about all objects in netTerrain, it’s easy to manage, troubleshoot, answer questions, plan, and help make informed decisions.
Searching diagrams
Because netTerrain maintains an internal database of your information you can perform data searches across some or all of the diagrams in netTerrain. You can print out the search-result table, export the search result tables to .CSV, export the diagrams in Visio, PDF, or as a HTML output.
Relationship modeling
netTerrain lets you see and understand system-wide relationships. Computer networks, enterprise models, and assets don’t exist on flat pages — neither should your documentation. netTerrain’s mission is to store and present information graphically and hierarchically, so connections between objects are tracked as carefully as the objects themselves.
What does this mean for you?
- You can examine a global view of your corporate network and drill down in seconds through a region, a site, a building, a floor, a wiring closet, down to a single port.
- Select two objects in distant diagrams and see, on the fly, how they are connected.
Because the entire project’s data is maintained in a central repository, it takes only seconds to go from the top of the hierarchy down to the smallest room, function, or port.
Embedded documents
netTerrain can be used to store documents and files, embedded with any object in the project. The management of stored documents, a central document repository, includes features such as check-in, check-out, versioning, downloads, locking and have a history of files.
The ability to use netTerrain for document storage means that users can control the change and flow of documentation within the organization. Users can take advantage of this feature for the storage of user guides, processes, configuration files, diagrams designed with other tools, etc.
Enterprise architecture/visualizing complex diagrams
With netTerrain’s hierarchical diagrams, it is easy to see the relationships between each diagram. To facilitate cross-agency analysis, you can leverage netTerrain’s platform to provide a web-enabled forum for collaboration among your subject matter experts, customers, and executives.It’s easy to import data from CA netViz, MS Visio, spreadsheets, and data sources.
Our main product is netTerrain, and within netTerrain there are various flavors and add-on modules:
netTerrain’s Logical Documentation Software:
- Create logical & physical views of networks, systems, and applications
- Crate as-built pictures of your environment
- Import data from spreadsheet/s, CA netViz projects & MS Visio diagrams
- Auto-generated network Topology maps through netTerrain Collector
- Supplement existing systems including Service Now, Solarwinds Orion, Spectrum, and vCenter
netTerrain Data Center Infrastructure Management (DCIM) Software:
- Manage the data center rack space capacity, power and weight availability
- Extensive catalog of smart devices and subcomponents
- Port to port cable and circuit management
- Circuit layout records and dynamic connectivity views
netTerrain Environmental Monitoring Module:
- Real-time power/temperature monitoring of data center devices
- Set power policies, find underutilized servers, increase rack density, trending analysis
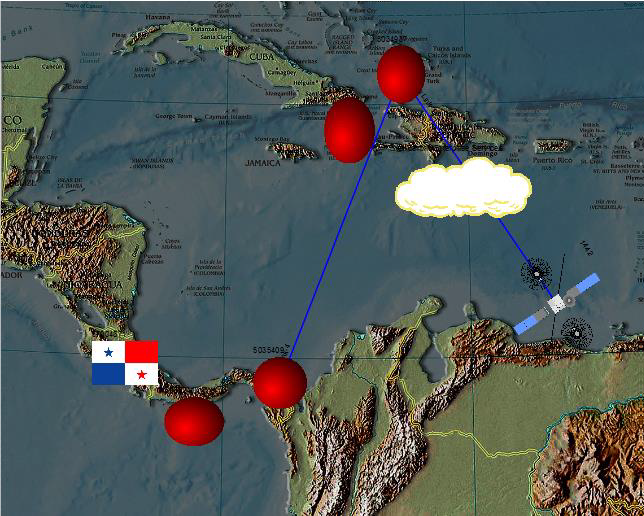
- GIS web maps with 19 levels of zooming to street level with latitude/longitude coordinates
- Ideal to document fiber plant and visualize poles, manholes, towers, and antennas
- Create and manage splices down to the strand level (with splice points) and cross connect each strand to fiber panels and other inside and outside plant elements
Graphical Networks, founded in 2007 (and launched netTerrain in 2009) is classified as a small business focusing on delivering automated web-based diagramming software solutions. Graphical Networks also offers consulting services, which includes training, implementation services, and can provide a full turnkey solution, including being a contractor as a documentation specialist for your project.
With netTerrain, organizations can produce graphical visualizations of the data which will significantly reduce the time needed to comprehend the results of analysis of the complicated relationships that are characteristic of complex endeavors. If you’d like a demo, click here ; if you have questions, reach out to sales here and we’ll get right back to you!