
In the past, I’ve discussed how our IT documentation software netTerrain helps users discover and map the network as well as access up-to-date network diagrams. When giving demos of our software, we’re often asked if we offer logical or physical views of the network (and about the differences).
As we’re often asked this, it only makes sense to spend some time blogging about the differences in diagrams. But — before I go more in-depth on the physical network view vs. the logical network view — let’s first quickly cover why these types of diagrams are important for businesses to have in the first place.
Network diagrams do the following:
- provide a picture of how your networks operate
- help identify network objects, such as routers, firewalls and devices,
- and show how they are all connected.
In a nutshell, diagrams help network engineers and operators understand and troubleshoot network issues faster, gain control of network capacity, and assist in network asset inventory.
What are the differences between logical and physical network diagrams?
Logical Network Diagrams
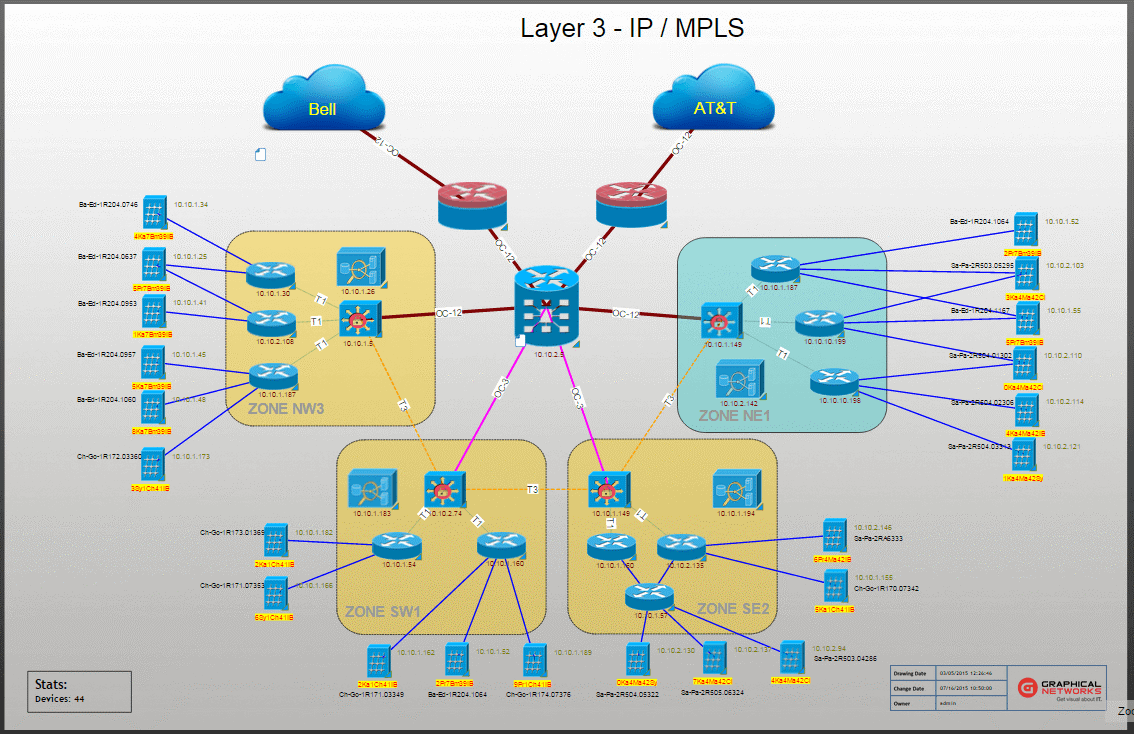
A logical network diagram describes how information flows through a network. Logical diagrams typically show subnets (including VLAN IDs, masks, and addresses), routers, firewalls, and its routing protocols. Note that we will be discussing the Open Systems Interconnection (OSI) model when discussing logical network diagrams — click here for an in-depth reference of the OSI model.. With netTerrain, you can create any logical diagrams, including: Layer 1, 2, and 3. Most of the network diagrams that are drawn focus on Layer 3 (L3) aka the network layer.
Layer 3 is responsible for the way in which data is communicated — both within your network and with other networks.
These L3 diagrams focus on path destinations (mainly) routers and firewalls:
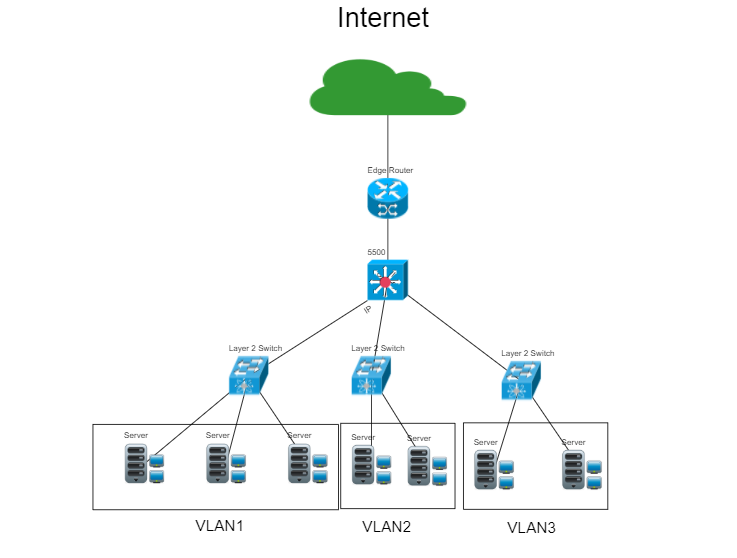
Layer 2 shows the physical addressing, the data links between adjacent objects like switches and trunks. They include critical information like which VLANs are included in which trunks, and they show spanning tree parameters, such as the diagram below:
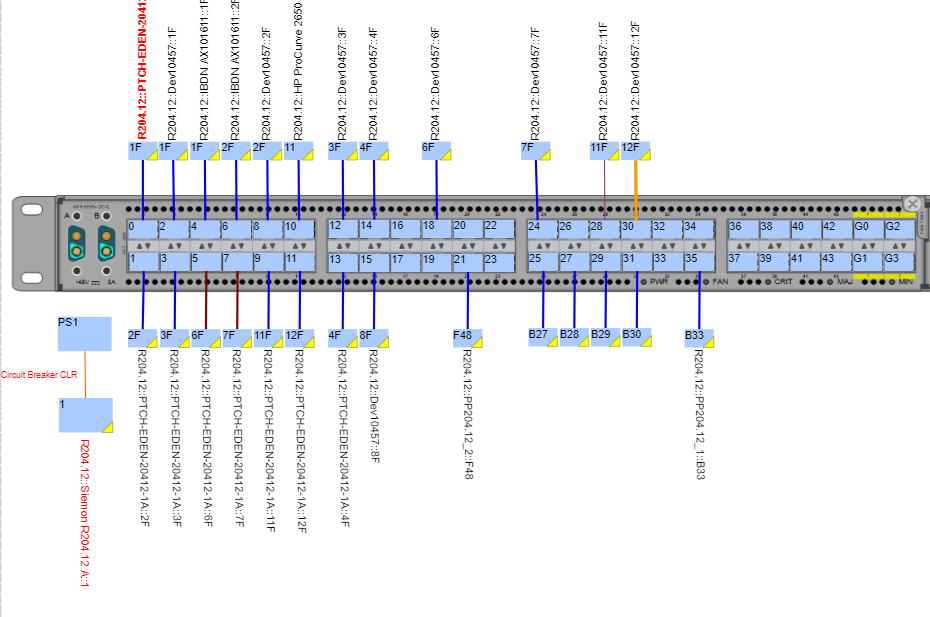
Layer 1 shows purely the physical layout: ports, cables, servers, etc. One of the most important aspects of Layer 1 diagrams: the physical cabling that connects physical devices in a network. These diagrams show the to-and-from port connections — and show the various connections (such as copper or fiber) in a different line, shape, or color, to distinguish the connector types.
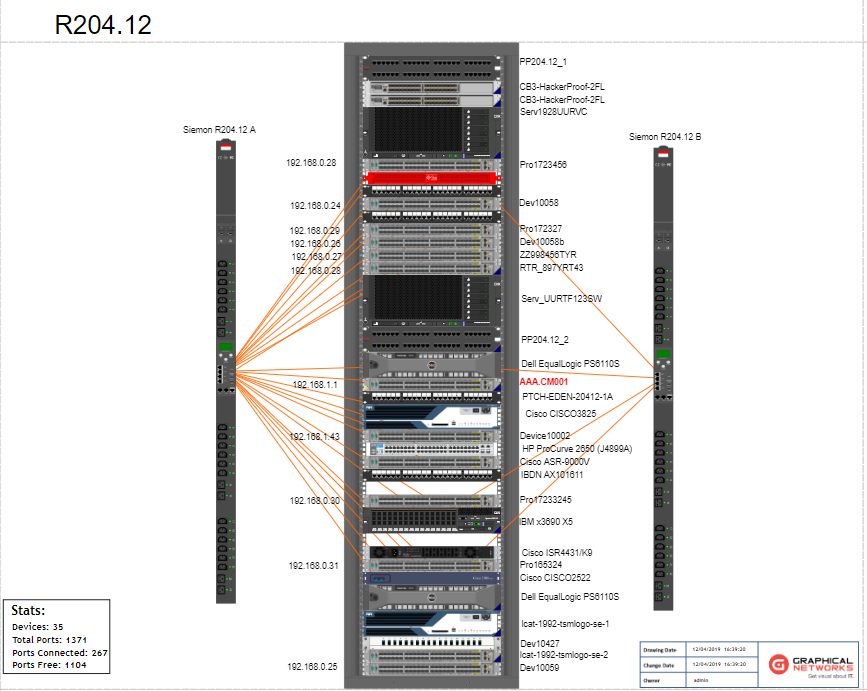
Physical Network Diagrams
Physical network diagrams show all the physical assets inside buildings, floors, and rooms. Whether the devices are inside a telecom room, data center room, or office space rooms, think of it as though you are seeing a bird’s eye view of your floor. With these diagrams, you can visualize how everything is connected — from ports of a device, cables going to and from ports, the racks/cabinets, and the equipment inside the rack, such as patch panels and servers, and all of the cabling inside the racks too. >Want to learn more?Click here for a detailed explanation on physical network diagrams..
2
When documenting your networks, both types of network diagrams are important — and you can create both logical and physical network diagrams with netTerrain.
With effective network diagrams, there’s no need to keep tens, or hundreds, of spreadsheets and Visio diagrams: you can eliminate the guessing game on when they were last updated. Your staff will work and plan out the network more efficiently, identify problems and fixes — and better plan for network capacity to support your organization’s growth.
netTerrain is a web-based visualization program and so it’s centralized — which means that all of your diagrams and data can be accessed by anyone in your organization (if they have permissions to view or edit the diagrams). If you’d like to try netTerrain, or have more questions about the software, you can schedule a demo here or reach out here.