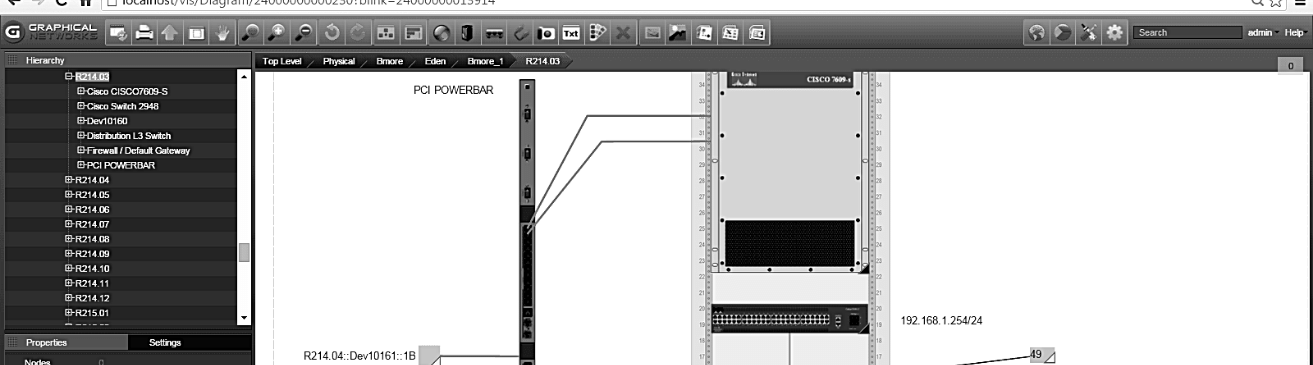
 How much space do you have in a rack? Can you power another device without overloading a circuit?
Whenever you have a question you can’t fully answer, you need to ask yourself this: how would the most interesting man in the world handle this one?
He’d need a way to handle it without breaking a sweat…a way that makes the whole thing look effortless. So…he’d use netTerrain, of course.
Why? With netTerrain, you gain a solid grasp on what’s going on in your racks. ‘Rack utilization’ gives you specific information about capacity in terms of space and power. You can discover the capacity of each rack, where you have available space and, if you are monitoring your power, where you can power a given device without overloading a circuit.
So, if our guy needed to know which cabinets had space for new equipment, he’d open up netTerrain. From there, he’d go right into a data center and easily visualize, in detail, which cabinets have space for new equipment (he could also look at how much power is being consumed by each cabinet).
Where’s this data coming from? It’s coming from anywhere you’ve got it.
With power monitoring, for instance, you can monitor a sensor (such as a temperature or humidity sensor). netTerrain DCIM can automatically grab information from this sensor and then you can create a visual override to display or convey info about a status change: is it getting too hot in the data center or too hot in a particular cabinet? Or take data directly from devices, like servers, and use the sensors built into the devices you have in the racks!

This data can come from SMNP, IPMI or WMI. With the right solution, the data sets you can get your data from are unlimited: VM, VMware, WMI data from Windows servers, and external systems from Cloud services such as AWS.
When a visualization solution is extracting data about your network, what you can manage is also unlimited. You can find any connected device (or link or circuit) that is down and visualize any devices that are also impacted. You can plan ahead based on capacity and power; you can monitor power consumption and temperature. Ultimately, visualization software will make your work easier and more effectual.