
In our first blog in this series on settings for our outside plant software, we explained the need for settings in the context of fine tuning you Data Center, Network Documentation or Outside Plant project and we looked into a specific repository of parameters called Settings.xml. In our second blog in this series we looked into specific settings notifications, usability and visualization.
In this third installment of this series, we will specifically look at a special set of parameters reserved for dynamic maps, OSP circuits, strands and the like (i.e: fiber and outside plant).
The features and functionality surrounding our outside plant tool seem to be prone to these settings
Map and general OSP settings
You can set up your Open Street Map server, which will involve a little bit of fiddling here and a whole let of steps in your environment (see the Outside Plant section on your User Guide).
Map layers
Open Street Map, which is the map technology or GIS system we use for our outside plant maps includes three different layers or types of views to render maps. We have three settings related to those, that let you specify the source of the map tiles that comprise the layers.
– MapSourceStandard: here you set up the source for the standard layer tiles.
– MapSourceTransport: same, but for the transport layer.
– MapSourceLight: same, but for the light layer.
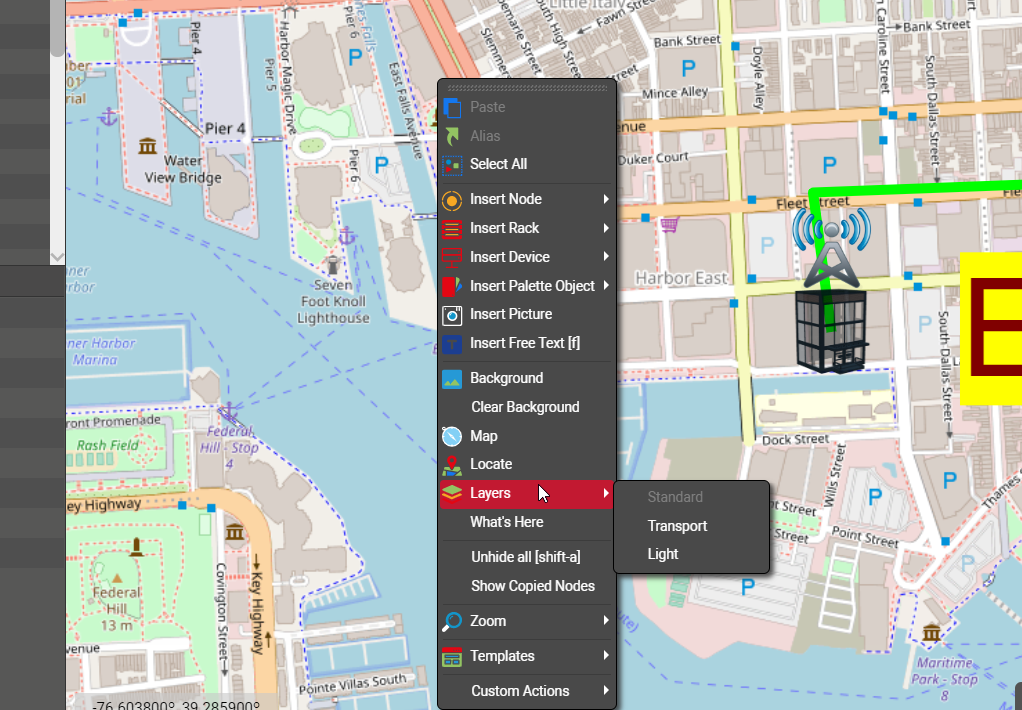 OSM Map layers
ZoomedOutObjectMapping
This one is quite important for proper tuning of the outside plant diagrams and deals with the representation of objects that look very small as you zoom out. As opposed to other regular diagrams, in outside plant projects it is very common to have large geographical areas be represented on one diagram by one OSM map. In those diagrams you may have nodes that you only see once zoom in a lot. In zoomed out mode those nodes would then basically disappear. But if that’s the case then you wouldn’t know where to find them when you first access that map.
For that purpose, we let you control how you would want those nodes represented in zoomed out mode. We can show clusters of nodes at zoomed out levels, so that at least you know where on the map you have nodes. We can also use halos, which are representations of the nodes that always look the same and have the same size on a diagram regardless of zoom level. The possible values are:
– 1 – Show clusters and halos
– 2 – Show halos only
– 3 – Show nothing
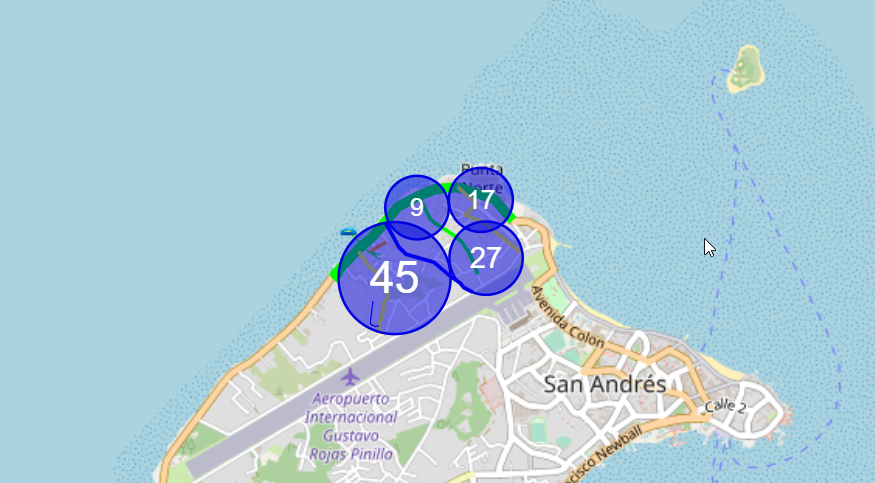 Outside plant map showing clusters
Circuit settings
Circuits are special Outside Plant elements that consist of end-to-end connections or services with their own special set of rules. For circuits we provide three settings:
– CircuitNameLabel: the representation of the name field in circuit tables views in case you don’t want it to literally say ‘Name’.
– CircuitTableDeleteButtonLocation: a bit obscure, this setting lets you control where on a table view you want the delete button to be located. 0 means left, 1 means right.
– CircuitNamesNotEditable: when set to true, circuit names cannot be edited on the table views after they have been created.
Strand settings
Strands are another special Outside Plant element with their own special set of rules. Strands pop up on a cable when a catalog manager creates that cable type in netTerrain with a non-zero strand count property value. For strands we also have some special foo that lets you fine-tune your fiber campus and outside plant diagrams:
– StrandStatus0: default status value for the strand, when it is first created as part of the cable.
– StrandStatusUndefined: the value you want represented for strands when a status is not defined.
– StrandModeUndefined: same as above, but for strand modes.
– StrandStatusValues: the list of status values that are permitted for strands. The usual values are “0,2,4,6,8,12,24,48,72,144,288,512,1024”.
– StrandModeValues: same as above but for strand modes. The typical values are “Single,Multi”.
– AddLinkTypeStrandsQtyValues: list of all the possible strand counts that can be defined for a cable containing strands.
– StrandNamesNotEditableOnDiagram: when set to true, strands names cannot be changed on a diagram. They are predefined in the catalog.
– StrandModeNotEditableOnDiagram: same as above but for the mode.
– HasStrandMarkerPosition: here you can define the position for the marker on a port, if said port has strands connected. The possible values include 0 (bottom right of port); 1 (center) and 2 (bottom left).
BOM settings
Along with all the elements above, in Outside plant projects you can also define a Bill of Materials report that is generated from a circuit layout record.
Two settings help you customize these reports:
– BOMReportCustomTextFilePath: the location of a file that can contain custom text that appears in every BOM report. The default is the netTerrain root folder.
– BOMReportBorderColor: self-explanatory.
This concludes our settings series, which, as you can see, got pretty geeky into the details around your DCIM, Outside Plant and Network documentation project fine-tuning.
Happy Documenting!