In network management, it’s common for businesses to use different tools for monitoring networks and then for documenting IT infrastructure. In a sense, it’s like trying to use separate apps for 1000 emails or more and the same number of appointments — which can lead to a gap between a network’s actual status and its recorded state.
Our software, netTerrain, bridges the gap.
Originally a tool for detailed IT infrastructure documentation (like a city’s infrastructure blueprint), netTerrain now includes network monitoring. This gives it all the visibility that a map (for example, of a city) gives — but with real-time traffic information layered on top.
Businesses often face a challenge when integrating netTerrain with their pre-existing monitoring systems. However, this integration is beneficial. It’s similar to syncing email and calendar apps, ensuring seamless operation. With netTerrain, businesses avoid redoing network documentation and automatically update their network maps, keeping them aligned with the network’s real-time status. This integration streamlines network management, saving time and improving accuracy and efficiency.
A monitoring tool that we see quite a bit is Nagios.
What is Nagios?
Nagios is an open-source IT management application that monitors systems, networks, and infrastructure. It’s used to check the status of hosts and services, and to alert users when problems are detected.
Nagios can be used to monitor a wide variety of systems and services, including:
• Servers
• Network devices
• Applications
• Storage devices
• Databases
• Web services
Nagios is a client-server application with a REST API to integrate it with third-party applications. The Nagios server is responsible for scheduling checks, receiving results from the clients, and notifying users of problems. The Nagios clients are installed on the systems and services that are being monitored.
Nagios can be used to send alerts to users in a variety of ways, including email, SMS, and paging. Nagios can also be used to generate reports and graphs, which can be used to track the performance of the monitored systems and services.
Just like most other monitoring tools, Nagios does not offer much of a visual representation of the network (at least not at the level of netTerrain), and doesn’t provide any physical representation of the network or display of non discoverable items, such as racks, cables, patch panels and so on, let alone features for Data Center Infrastructure Management (DCIM) and/or Outside Plant.
Integration Architecture
You can leverage your Nagios data and automate the creation of feature-rich, beautiful physical and logical diagrams by integrating Nagios with netTerrain through the so-called netTerrain collector.
Nagios is a multi-platform system utilizing the so-called Nagios Core which has access to the network infrastructure.
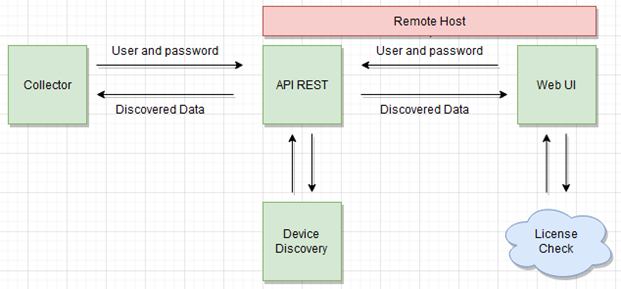
On the netTerrain side, it is the netTerrain collector that does the importing of the Nagios data via its REST API. The collector must be able to reach the server where Nagios is located. The collector also needs to be authenticated against Nagios using a user and password. The Nagios XI API does not use a token, it uses an “API Key” that is provided through the graphical user interface, where the API must be activated.
Once activated, the collector can then discover the Nagios data and send it to netTerrain. Here’s a basic data flow architecture:
To configure the Nagios integration on the collector side, first start the netTerrain collector and then click on the gear icon associated with the Nagios connector located in the connector list.
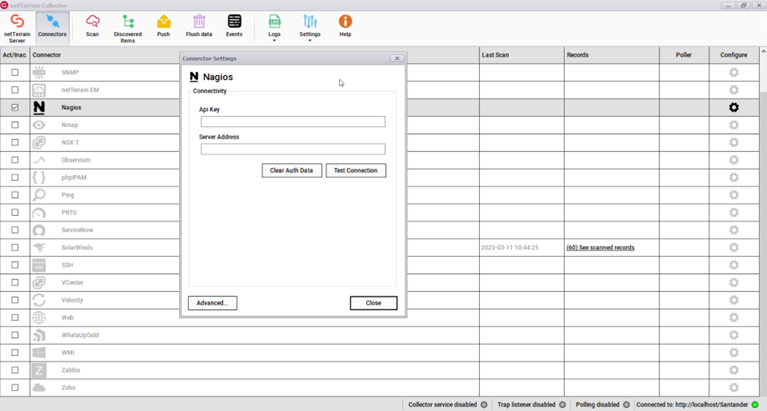 Collector configuration dialog for Nagios
The Nagios integration utilizes the REST API needing the following credentials and parameters:
* API Key
* Server Address
Currently the connector brings in basic data from the list of hosts and services that Nagios discovers:
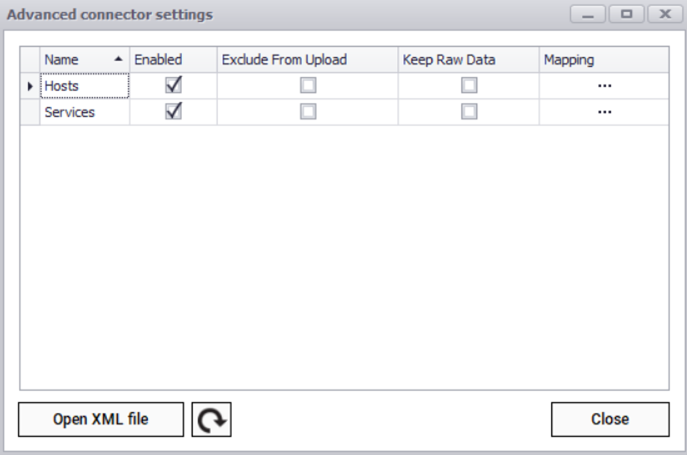
Each sub connector can also retrieve some default properties which can be edited from the xml configuration file.
These properties include:
For hosts:
*HostName
*HostObjectId
*DisplayName
*Address
*HostAlias
*IconImage
*IconImageAlt
*Notes
*NotesUrl
*ActionUrl
*HoststatusId
*InstanceId
*StatusUpdateTime
*Output
*LongOutput
*Perfdata
*CurrentState
*HasBeenChecked
*ShouldBeScheduled
*CurrentCheckAttempt
*MaxCheckAttempts
*LastCheck
*NextCheck
*CheckType
*CheckOptions
*LastStateChange
*LastHardStateChange
*LastTimeUp
*LastTimeDown
*LastTimeUnreachable
*StateType
*LastNotification
*NextNotification
*NoMoreNotifications
*NotificationsEnabled
*ProblemHasBeenAcknowledged
*AcknowledgementType
*CurrentNotificationNumber
*PassiveChecksEnabled
*ActiveChecksEnabled
*EventHandlerEnabled
*FlapDetectionEnabled
*IsFlapping
*PercentStateChange
*Latency
*ExecutionTime
*ScheduledDowntimeDepth
*FailurePredictionEnabled
*ProcessPerformanceData
*ObsessOverHost
*ModifiedHostAttributes
*EventHandler
*CheckCommand
*NormalCheckInterval
*RetryCheckInterval
*CheckTimeperiodObjectId
For services:
*HostName
*ServiceDescription
*DisplayName
*HostObjectId
*HostAddress
*HostAlias
*IconImage
*IconImageAlt
*Notes
*NotesUrl
*ActionUrl
*ServicestatusId
*InstanceId
*ServiceObjectId
*statusUpdateTime
*Output
*LongOutput
*Perfdata
*CurrentState
*HasBeenChecked
*ShouldBeScheduled
*CurrentCheckAttempt
*MaxCheckAttempts
*LastCheck
*NextCheck
*CheckType
*CheckOptions
*LastStateChange
*LastHardStateChange
*LastHardState
*LastTimeOk
*LastTimeWarning
*LastTimeUnknown
*LastTimeCritical
*StateType
*LastNotification
*NextNotification
*NoMoreNotifications
*ProblemHasBeenAcknowledged
*AcknowledgementType
*CurrentNotificationNumber
*PassiveChecksEnabled
*ActiveChecksEnabled
*EventHandlerEnabled
*FlapDetectionEnabled
*IsFlapping
*PercentStateChange
*Latency
*ExecutionTime
*ScheduledDowntimeDepth
*FailurePredictionEnabled
*ProcessPerformanceData
*ObsessOverService
*ModifiedServiceAttributes
*EventHandler
*CheckCommand
*NormalCheckInterval
*RetryCheckInterval
*CheckTimeperiodObjectId
The collector can propagate the status readings into netTerrain so that when Nagios detects that a device is down, it shows up in red (or blinks, or whatever) in netTerrain. These effects are configured directly in the netTerrain catalog.
What are the main benefits of integrating Nagios with netTerrain?
As mentioned previously, if you want to document your network properly (and you should!), you would usually either run a network discovery first or enter the network devices and information manually. However, if you already have Nagios in your network doing discoveries and monitoring then (assuming you trust Nagios as a source of data) you probably want to avoid manually recreating the wheel in netTerrain, thus leveraging your Nagios data and at the same time automating the network documentation process.
To sum up, integrating Nagios with netTerrain streamlines network management by combining real-time monitoring data from Nagios with netTerrain’s advanced documentation and visualization capabilities. This integration eliminates the need for manual network re-discovery and ensures that network diagrams in netTerrain are automatically updated and accurately reflect the current network status.