Does this make my server look fat? Is my floor starting to bulge? Yeah, we have all been there.
The server room is starting to look a little heavy…or is it?
Hey, we’ve all told ourselves a few little white lies from time to time, ‘maybe it’s just the way the light is hitting this morning’.
Stop guessing in the dark and start getting data. Hands down, the best way to handle key information about your data center is to track its data.
Go out there, get that data and calculate. You can do it by hand, or with DCIM. It doesn’t all have to be snmp readings and real time data flows. Sometimes, you just need to track some specific data point (but you may also want to get some math going and do some calculations).
Examples of data you can track, include:
Weight:
You know your racks do have a capacity rating. More importantly, your floor may also have one. Get those numbers working for us — and put them to work.
Rack Utilization:
How about automatically doing some math as you rack mount equipment? You can enter the data yourself or use some manufacturer specs (although, keep in mind, that manufacturer specs are not designed for efficiency or based on actual power scenarios. If you follow manufacturer specs to the letter, you could end up with some seriously underutilized racks).
Need more? You could take advantage of a rack visual override so you can tell when you are running low on space or if the cabinet is getting a little too heavy.
Power:
Are power costs skyrocketing in your data center? When you have data, you can do something about it. With our power monitoring module in netTerrain EM, for example, you can monitor sensors (temperature or humidity). netTerrain can grab this information (automatically) and you can set a visual override to display info you need: is it getting too hot in a cabinet — or in the data center as a whole?
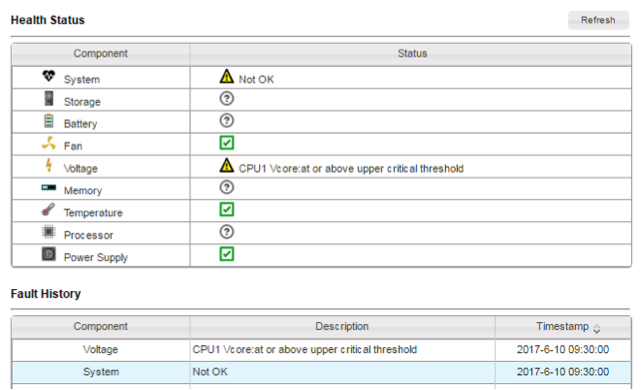
Server Health Status:
How about tracking the health of your servers (and their components). For example, when is the last time some server hardware went out and left you stranded? With netTerrain EM, you can get some predictive failure monitoring that tells you about potential issues before they progress.
Getting all that data sounds nice on paper, but if you’re managing a large network — it’s probably time to bypass the manual data entry and use DCIM. With netTerrain DCIM, our software, the data you use can come from anywhere: SMNP, WMI, IPMI, VM, VMware, WMI data from Windows servers, and external systems from Cloud services (AWS, for example).
Bottom line? When it comes to knowing more about your infrastructure and assets, you don’t have to keep guessing in the dark. Information is power: get your hands on key information about weight, rack utilization, power, and server health.
You don’t have to wait for your organization to sign off on DCIM software. While DCIM can certainly whip your assets into shape, you can take steps right now to collect data by hand and gleam some insights out of it.