In this blog (and video), we’ll explore how you can easily create hierarchies and navigate in and out of them using netTerrain (our network documentation network mapping tool and data center infrastructure management tool). Many DCIM solutions offer users just two or three predefined layers; with netTerrain, you can create an unlimited number of your own layers and hierarchies — from world map views all the way down to port and card views.
We give our customers this level of flexibility because, more often than not, they end up needing it. They need to see their IT Assets in different types of views, or they have different stakeholders, or they have more than one data center (or a combination thereof). If you’re shopping for DCIM software, this blog is here to help you discern whether or not you’ll need the flexibility of visualizing your assets in different layers and hierarchies.
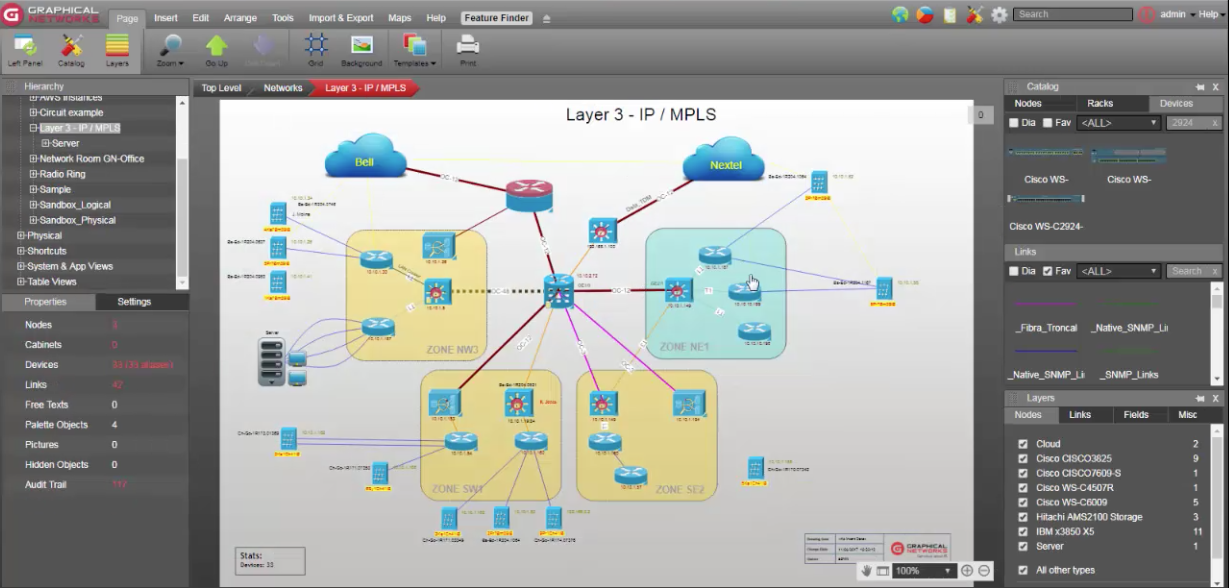
DCIM Logical Views
Our users often need Layer 3 IP/MPLS view for a given asset. And, to clarify: one asset in netTerrain is just one license (or record) in the entire database, regardless of different views or layers. An asset can be updated from multiple places — manually or automatically through a discovery or integration. When data points for an asset are updated, these points are simultaneously updated in every view/layer associated with the asset.
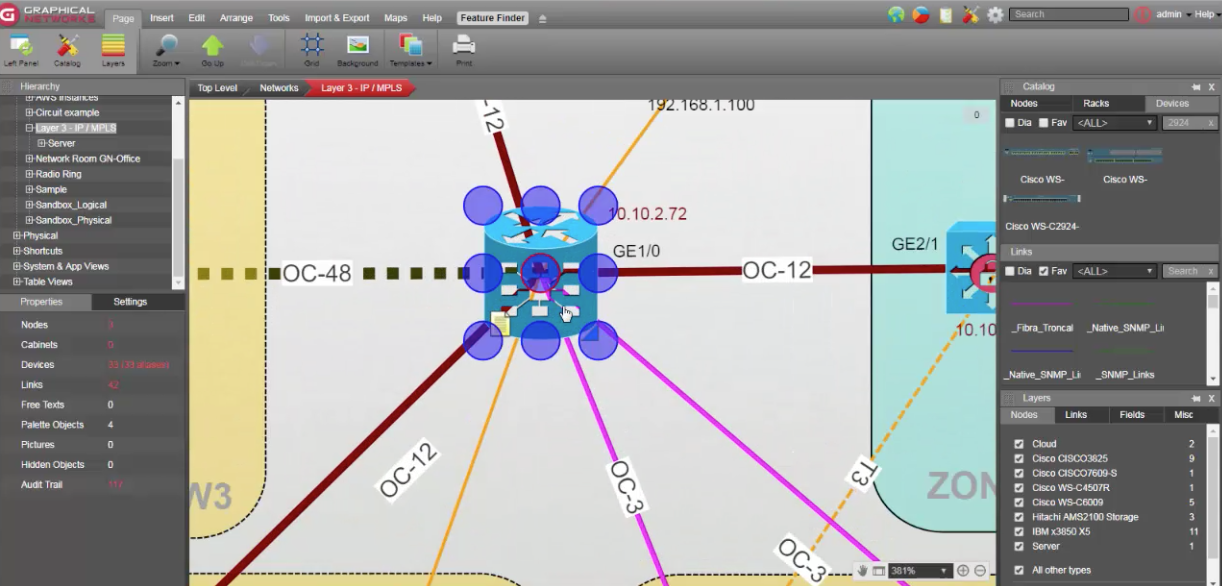
To access a Layer 3 view, you’ll drill down into whichever network you need to visualize. Within the network, you can have as many layers as you want. You can customize each layer however you need to: use your own background images, icons, and customize how you display the information on a diagram. netTerrain makes customizations as it is with a user-friendly drawing package.
When you’re in one view, it’s easy to jump around to other views. Simply double-click on a logical asset and you’re in the physical view your asset… double-click again to go up a level and you’re in the rack level view of the asset.
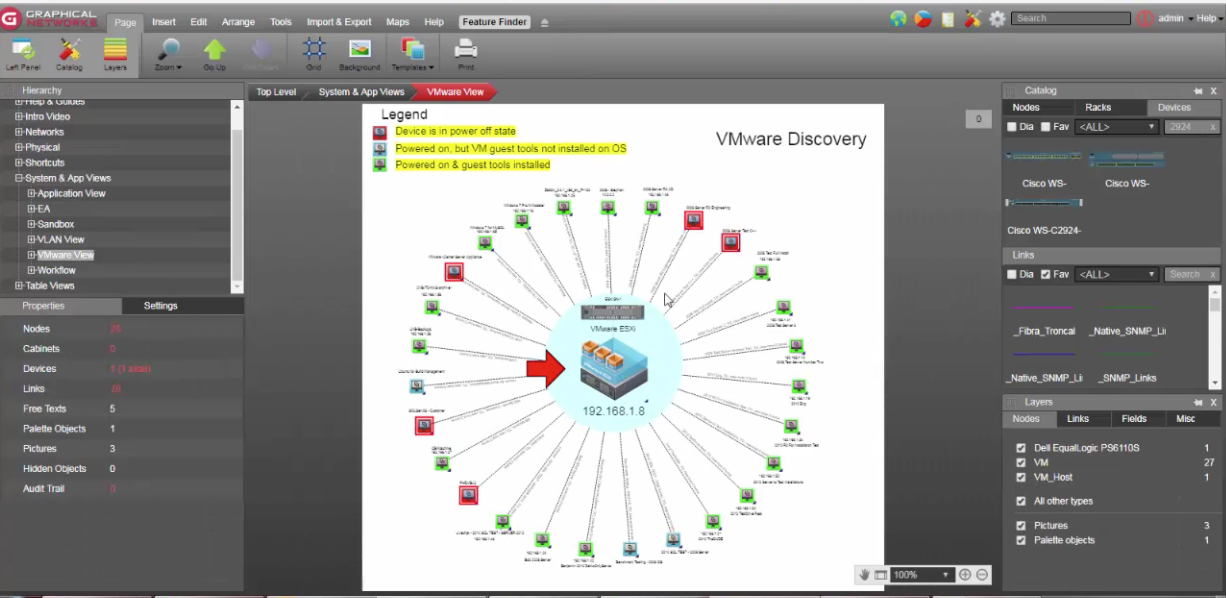
DCIM Application Views
It’s easy to access and customize application views with netTerrain. The layers, or diagrams, for applications are completely customizable in terms of how you want them to look and feel. In the image below, you’re looking at a specific VMHost — with different images and applications which you can isolate if you want to — for impact analysis purposes.
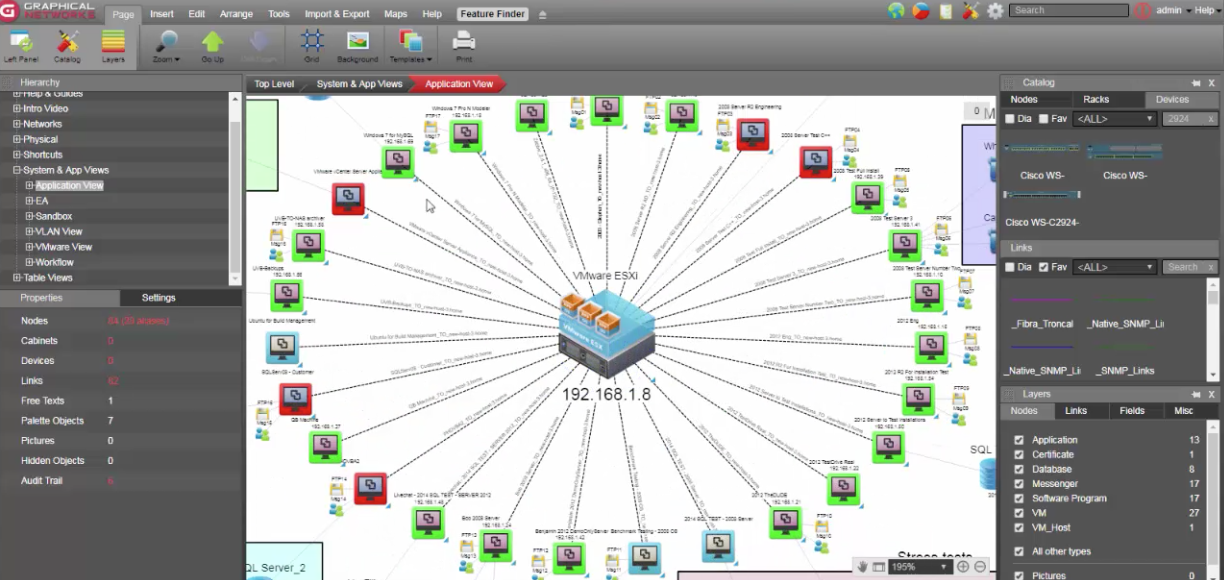
So, if you double-click on the VMHost here (which we discovered automatically from VCenter), you can see this same host and a different type of view — now with its hardware specifications.
If you double-click here, it takes you to the rack view.
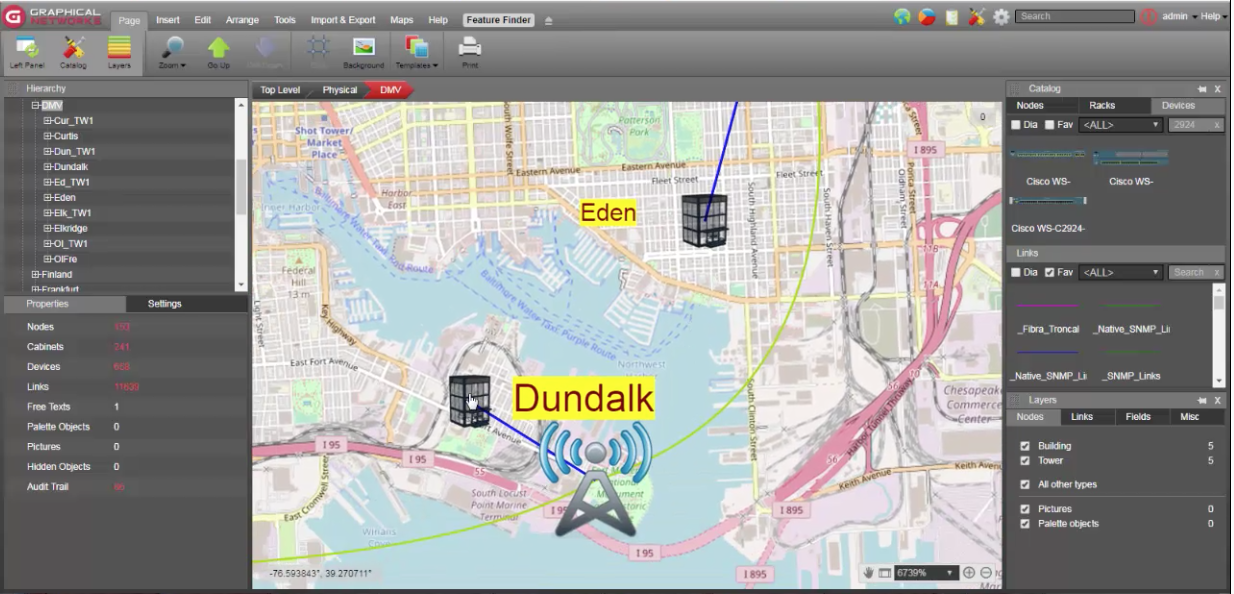
DCIM Rack Views
The rack view is one of the most common views that we see in DCIM applications (where our customers set up their own hierarchies). The rack view can be accessed from a global view of the map of the world — or a map of a specific region.

If you need to know exactly where each data center is located, these maps can be georeferenced with latitude and longitude values that drill down to the street level (we use OpenStreetMap for this). When you’re at the street level, you can double-click on a building to access what’s inside.
You don’t have to have this same type of hierarchy: set up your own simply by dragging and dropping objects onto a diagram: double-clicking lets you setup your own types of hierarchies.

Many of our customers want to use a picture of the building – they can add floors and data centers in each building.
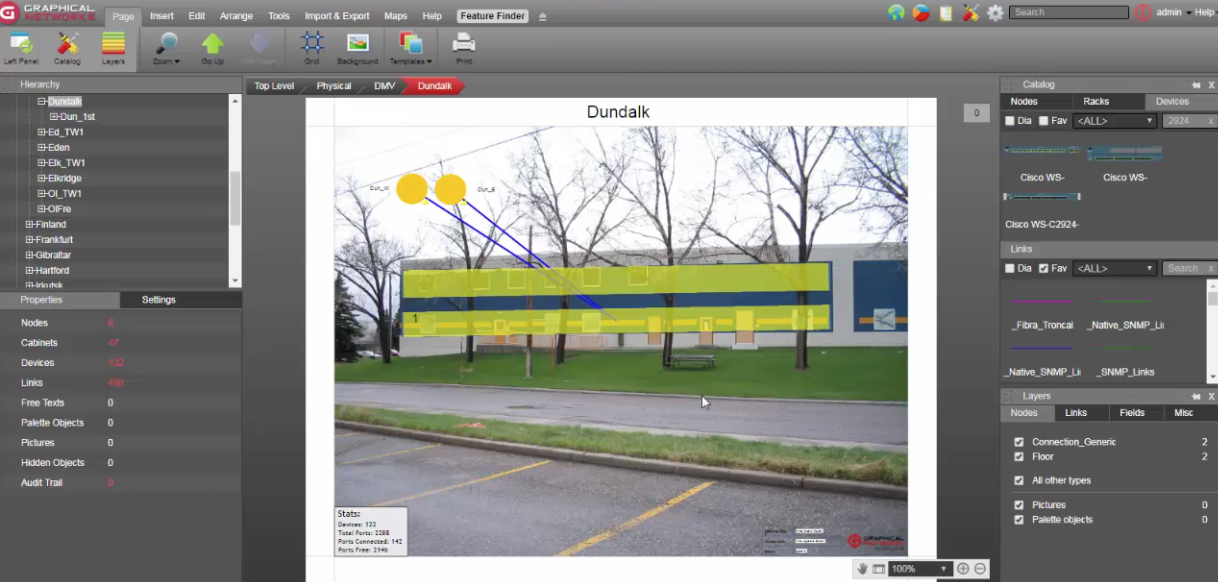
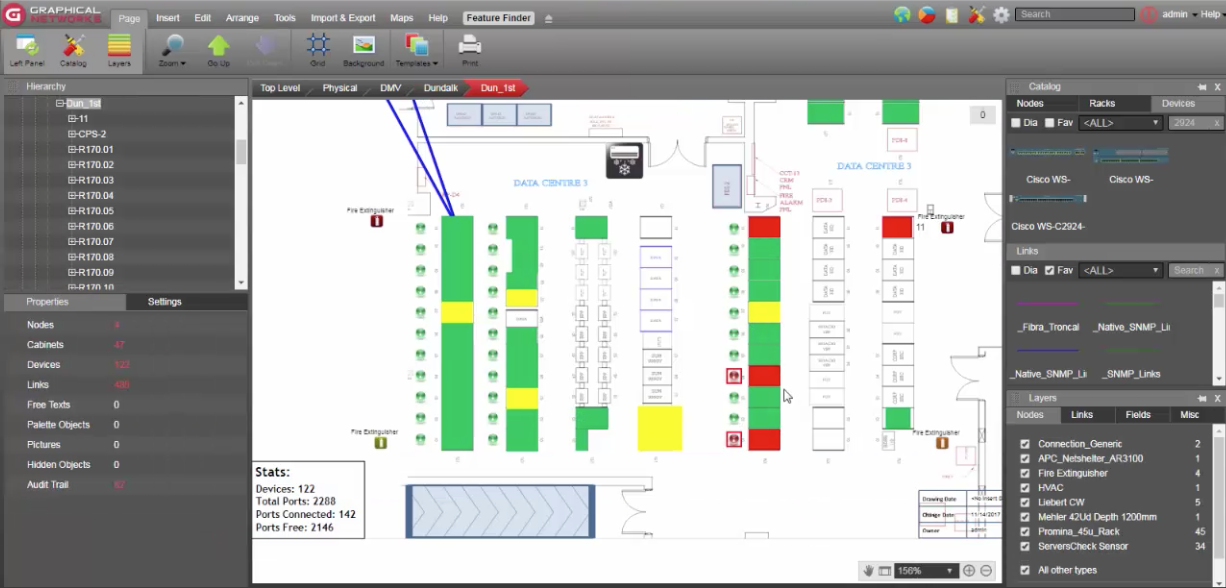
In the image below, you see a specific floor in a building with a data center image as the background. Many of our customers choose an AutoCad drawing for their background image — and then simply drag and drop rack objects on top of it. It’s that easy.
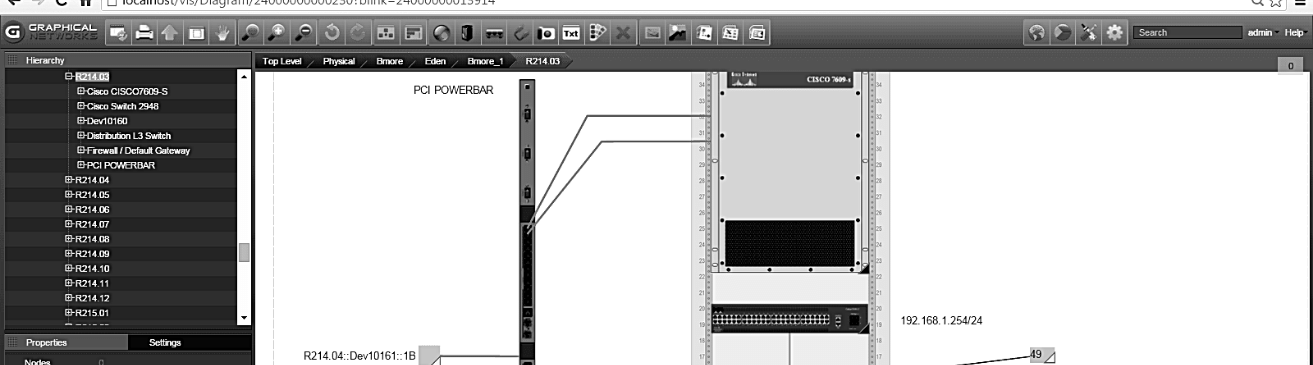
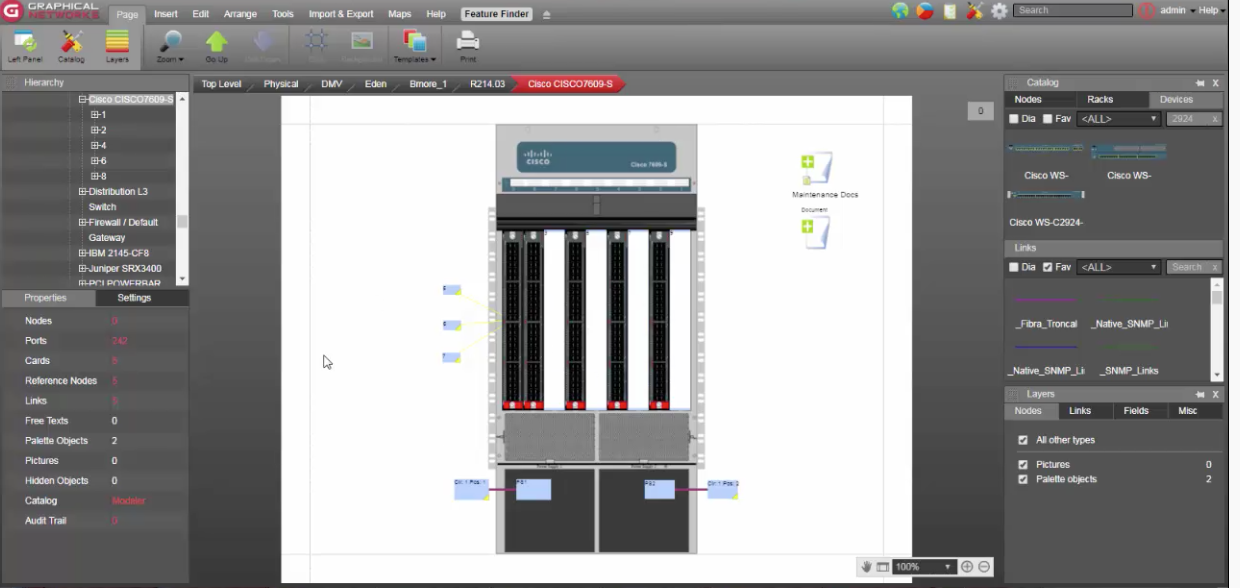
DCIM Object Views
netTerrain gives you full control over the types of objects in your data centers and inventories. You can add literally anything you can imagine. Creating a new object in the catalog takes minutes: you can create fire extinguishers, panels, racks, sensors as we air conditioning, power equipment, and anything that you can imagine even chairs and tables or whatever it is that you want to track as an asset in your inventory.
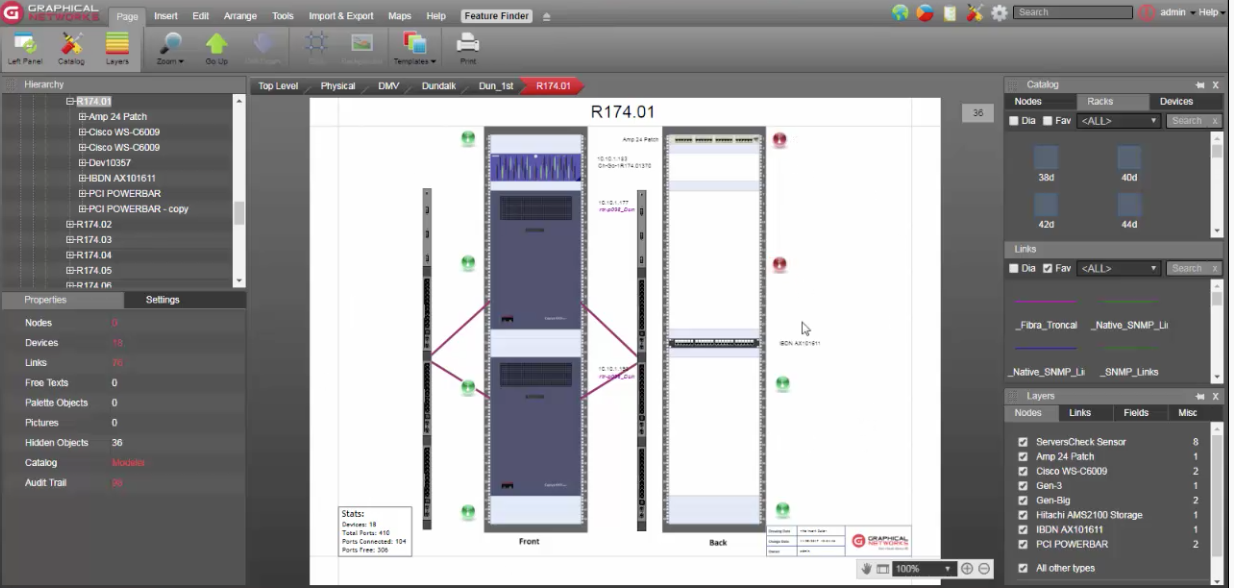
The image above is a cabinet with sensors. You can have as many sensors as you need — and you can customize them based on your criteria. Sensors can blink when they exceed a certain threshold, turn red…and so on. It’s all done through our drag-and-drop GUI-based rules engine/catalog. To get to the cabinet view, just double-click on whichever rack you need.
Here, you can also see we have four sensors, some power bars, some switches, and some routers: you can show connectivity with automatic Layer 2 discovery, you can import it from a spreadsheet, or you can manually add it with simple drag-and-drop. From there, you can tell netTerrain what kinds of connections you want to see: you can visualize just the rack level of your power connectivity, you can hide the copper, or you can drill down to a specific device and see how that device is configured.

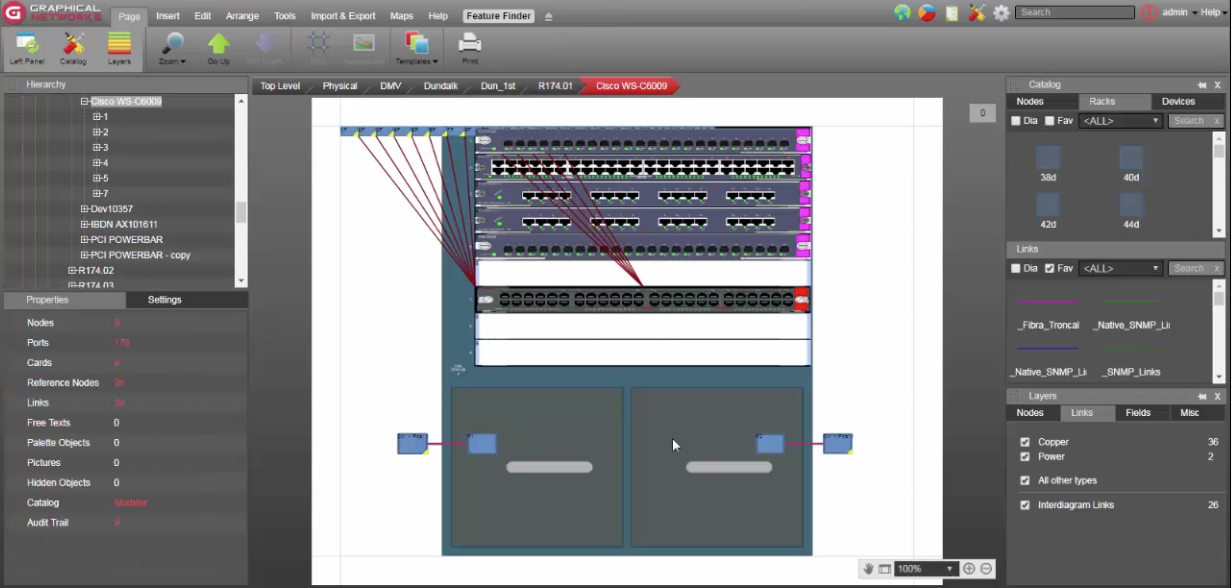
Your options here are endless: you can hide whatever connections you want, see which cards are on each backplane, see the power connectivity, drill down to the card level and see how each port is connected.
In sum: in this blog, you’ve seen examples of the types of views and layers you can have with netTerrain, and how easy it is to navigate between them. Getting an overview of your data center, and network documentation infrastructure, is as easy as double-clicking and zooming in and out.