Most network monitoring tools don’t really show you what’s going on in a visual way – it’s like reading a technical manual without any pictures (check out a blog that goes more into this called “what network documentation is not”). Usually, companies will use one set of tools to keep an eye on their network and a totally different set to document how their IT stuff is set up.
In the past few years, our IT documentation/visualization platform, netTerrain, has added features to monitor (like checking network status, environmental conditions, getting alerts) and visually document networks. This is a huge plus for IT managers because netTerrain does both jobs from one platform.
But here’s the thing: a lot of people who buy netTerrain to map out and document their networks already have a monitoring system in place. When you combine the two, you get the best of both worlds, of course, but you don’t want to start from scratch. With software like netTerrain, it’s easy to figure out your network, especially if you trust your current monitoring system. Plus, it makes documenting your network a lot easier and more automatic.
One common monitoring tool that works well with netTerrain is PRTG.
What is PRTG?
PRTG (Paessler Router Traffic Grapher) is a network monitoring tool that can be used to track objects that have an IP address such as servers, applications, and devices. PRTG is agentless, so you do not need to install anything on your devices to monitor them. It uses protocols such as SNMP, WMI, and SSH to collect data from your devices. It is quite similar to netTerrain in terms of protocol support.
PRTG features include Uptime monitoring, System health monitoring, Network, device and application monitoring, Virtual server and system usage monitoring as well as database monitoring.
PRTG also has a reporting engine akin to netTerrain’s dashboard generator that allows you to generate reports on your monitoring data. You can use these reports to track your network’s performance over time, identify potential problems, and troubleshoot issues.
PRTG is available in a free version and a paid version. The paid version offers additional features, such as unlimited sensors, historical data, and remote probes.
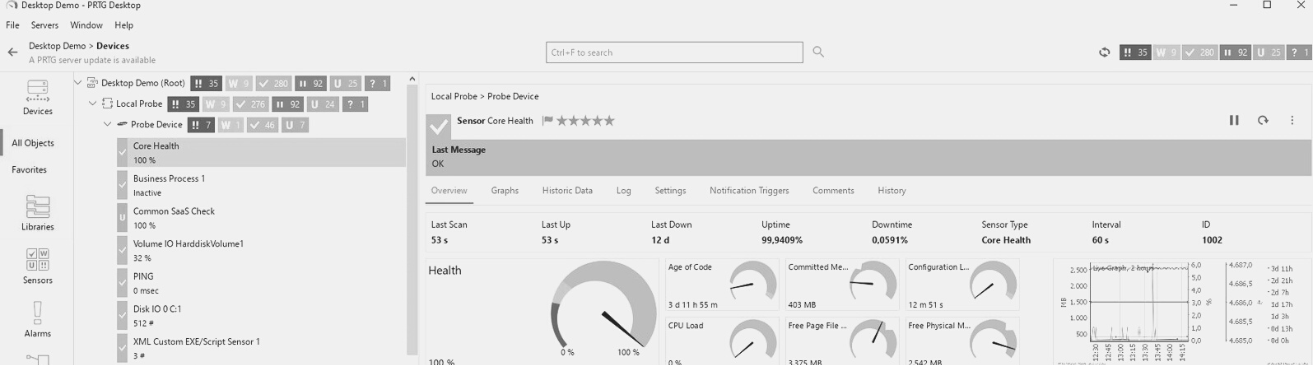
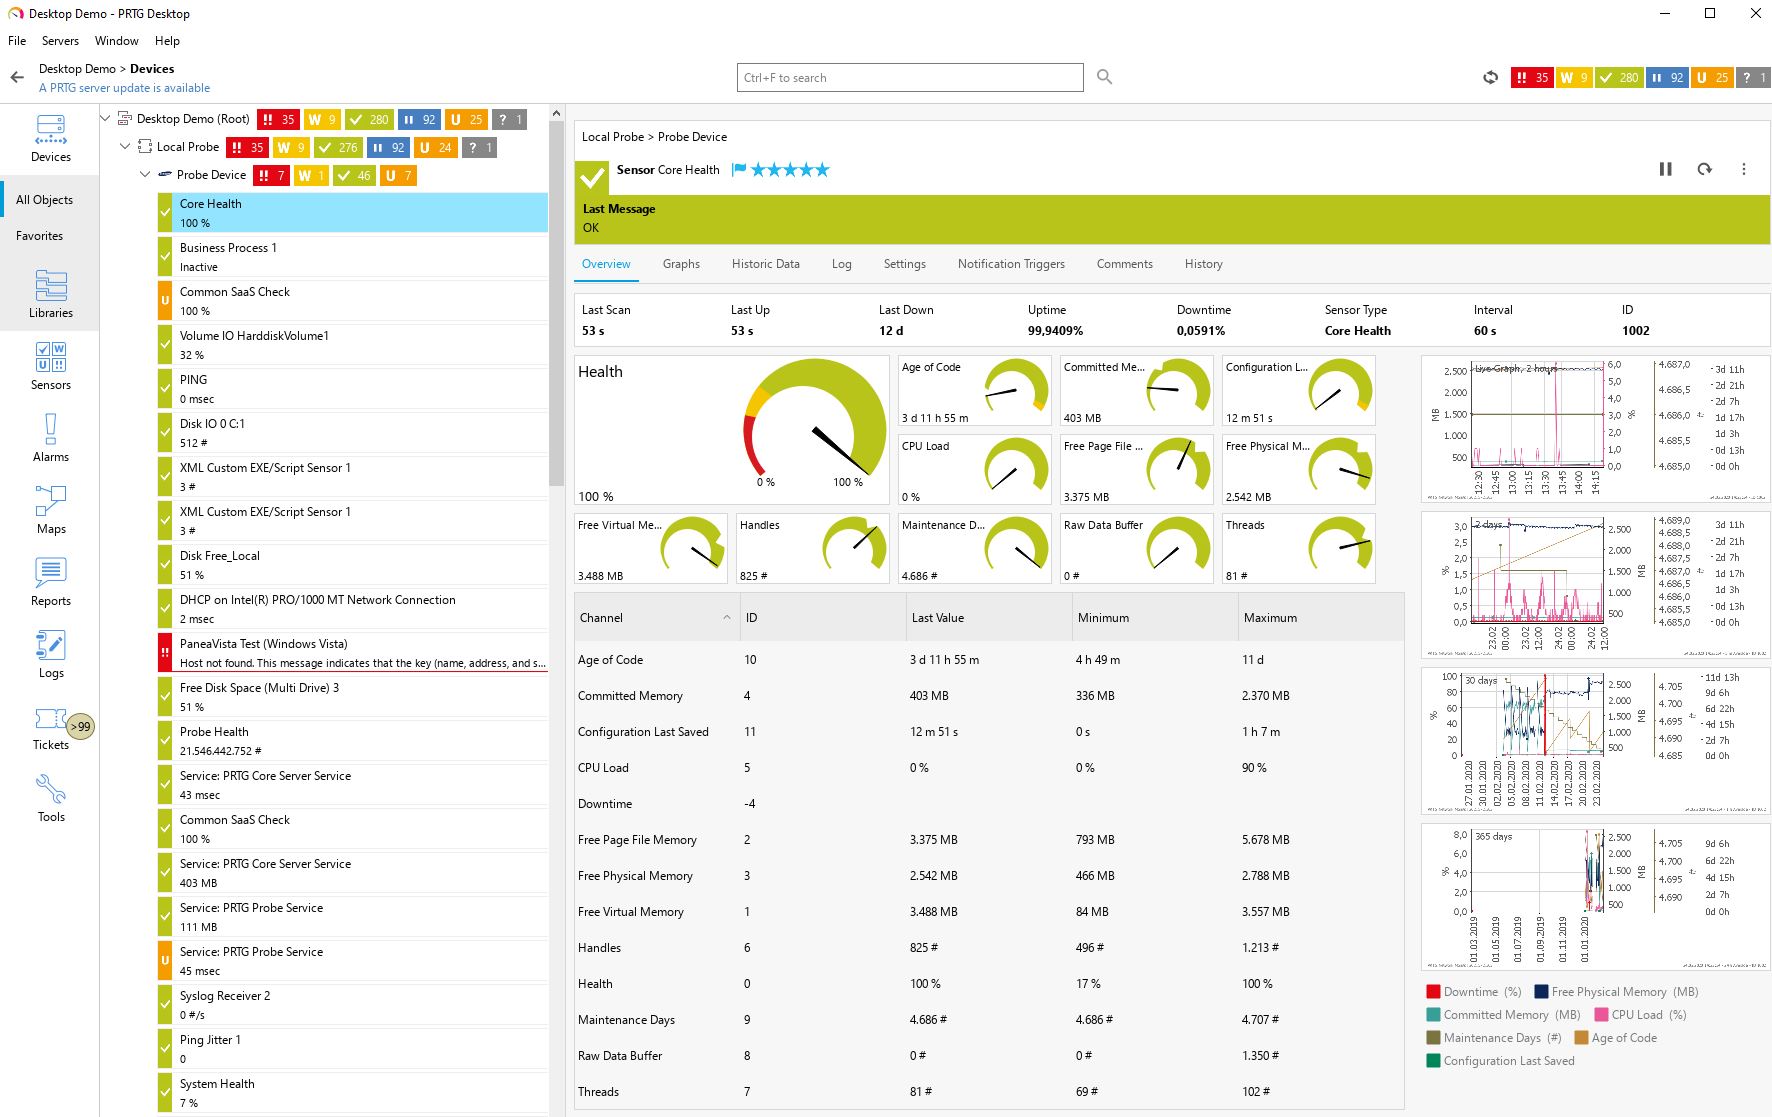
Much like other monitoring tools, PRTG lacks detailed visual network representations. Unlike netTerrain, it doesn’t show physical aspects of the network, such as rack layouts, cables, or patch panels. Also, it doesn’t display items that can’t be automatically detected and lacks features for managing data center infrastructure (DCIM) or managing external plant systems (netTerrain OSP fiber mapping software).
The focus with PRTG is not on diagrams or anything outside of the monitoring aspects themselves.
A quick google image search will show you lots of dashboards and table views, but very little in terms of topology views:
Integration Architecture
You can easily leverage your PRTG data and automate the creation of feature-rich, beautiful physical and logical diagrams by integrating PRTG with netTerrain through the so-called netTerrain collector.
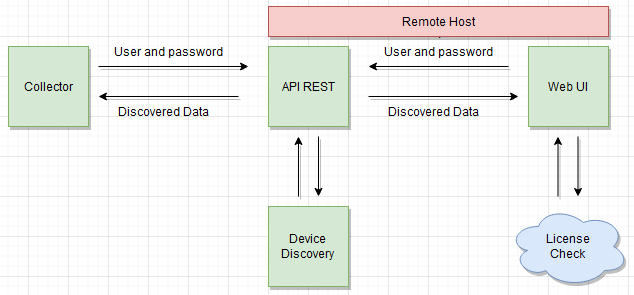
On the netTerrain side, it is the netTerrain collector that does the importing of the PRTG data via its REST API. The collector must be able to reach the server where PRTG is located. The collector also needs to be authenticated against PRTG using an API user, password and endpoint address.
With valid credentials the collector can then discover the PRTG data and send it to netTerrain. A basic data flow architecture is as follows:
To configure the PRTG integration, first start the netTerrain collector and then click on the gear icon associated with the PRTG connector located in the connector list.
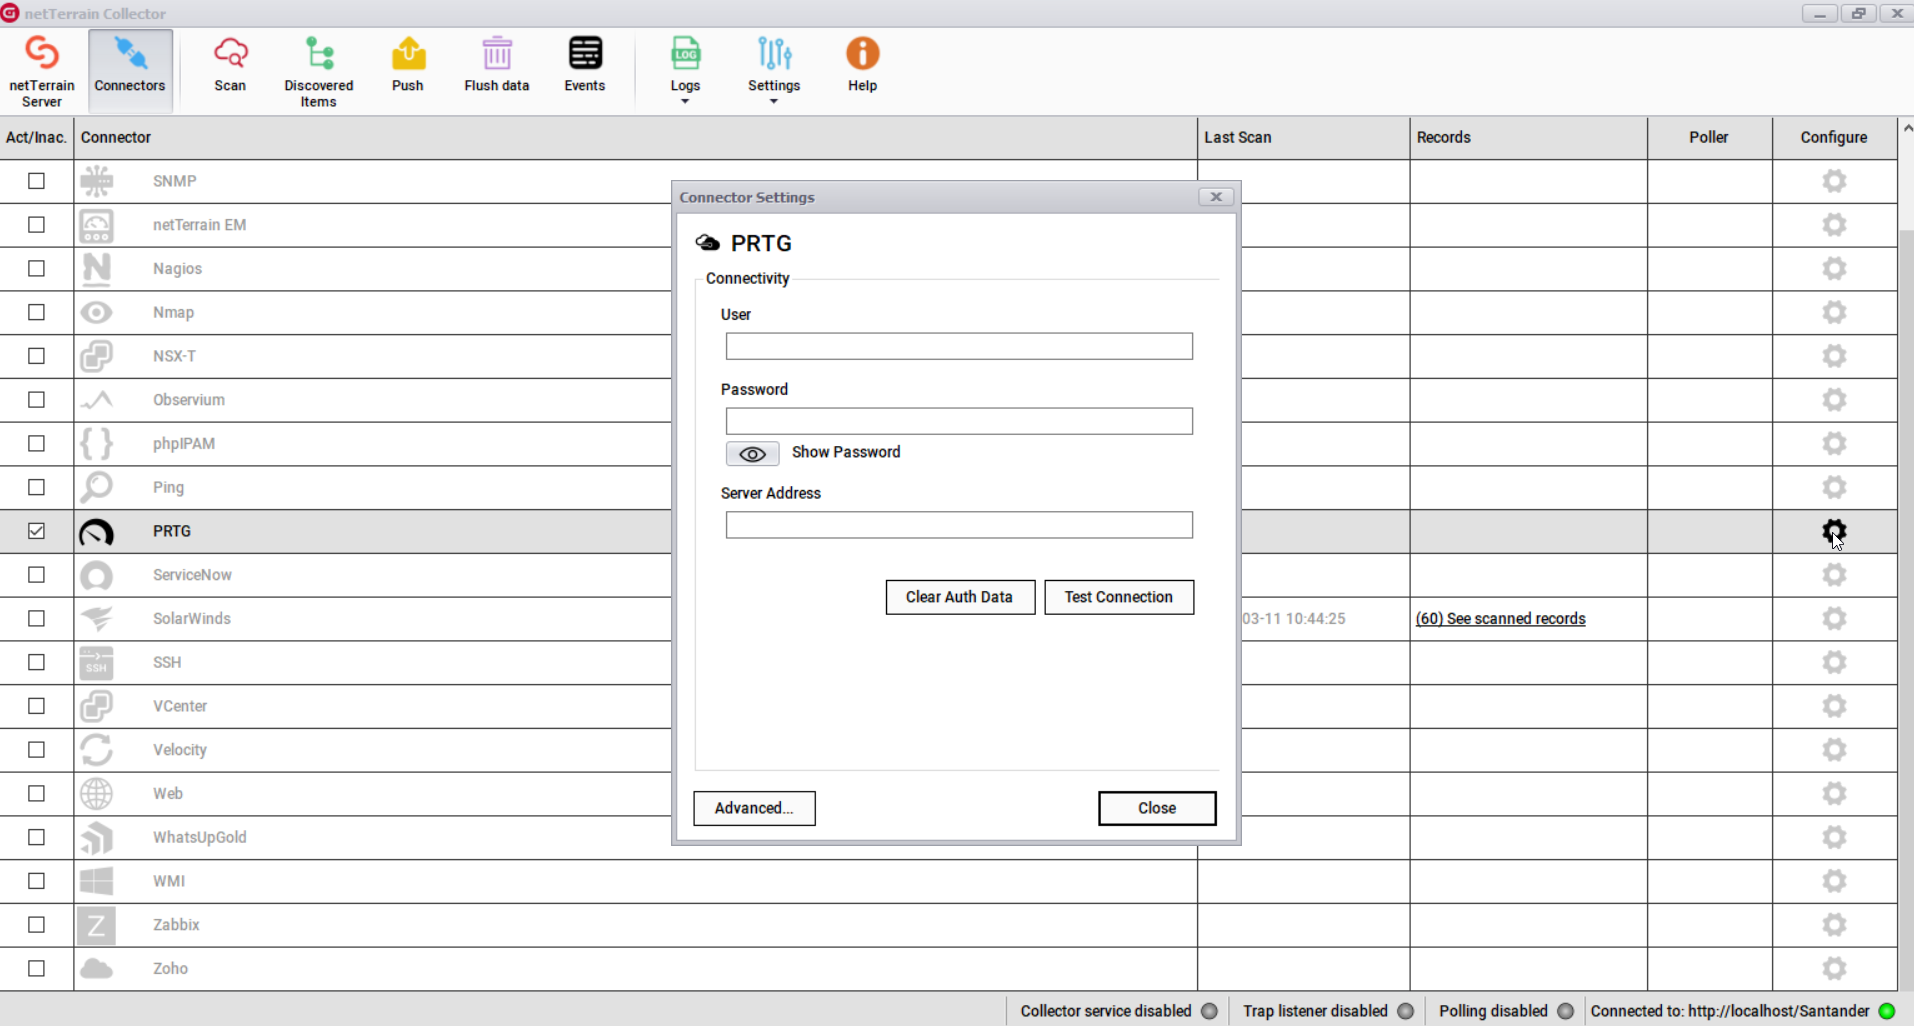 Collector configuration dialog for PRTG
The PRTG integration utilizes the REST API needing the following credentials and parameters:
* User
* Password
* Server Address (REST endpoint)
Currently the connector brings in basic data from the list of hosts that PRTG discovers, along with some default properties which can be edited from the xml configuration file.
These properties include:
*ObjId
*Group
*Device
*Sensor
*Status
*Active
The collector can propagate the status readings into netTerrain so that when PRTG detects that a device is down, it shows up in red (or blinks, or whatever) in netTerrain. These effects are configured directly in the netTerrain catalog.
What are the main benefits of integrating PRTG with netTerrain?
As mentioned previously, if you want to document your network properly (and you should!), you would usually either run a network discovery first or enter the network devices and information manually. However, if you already have PRTG in your network doing discoveries and monitoring then (assuming you trust PRTG as a source of data) you probably want to avoid to manually recreate the wheel in netTerrain, thus leveraging your PRTG data and at the same time automating the network documentation process.
In sum, for IT managers, merging PRTG with netTerrain is a game-changer. It’s like having a powerful tool box where you can both keep an eye on your network’s health and also get a clear, visual map of everything in it. This integration makes life easier by cutting down on the need for (and headache of) juggling multiple tools and instead gives you a more straightforward, efficient, and powerful way to handle network management and documentation tasks.