 Ever really look at a map of the airport? It’s a bustling network of terminals, concourses, shopping centers, food courts, kiosks, security checkpoints, and, of course, airplanes. If you’ve ever been delayed for hours, you know that airports can be a destination unto themselves (for better or worse).
Airports are constantly evolving — and their networks are always in a state of change and growth. Now more so than ever, as the concept of ‘intelligent airports’ is taking the aviation industry by storm, when network outages happen, big money is on the line. A study released by IHS in 2016 found that the average corporation experienced 5 different downtime episodes per month; the cost for a medium-sized corporation averaged a staggering $1 million dollars per year (in lost productivity, costs to actually fix the network, and lost revenue).
IHS Research Director Matthias Machowinski stated that the major culprits behind downtime can be broken down as follows:
40% Equipment failures and equipment issues
25% Human error and service provider issues
10% Cyber attacks and security issues
When outages happen at airports, other airports can be impacted and the ripple effect (and costs) can reach across the globe. While network monitoring — and maybe even keeping redundant equipment around ‘just in case’– can help prevent downtime and shorten the time to get the network back up and running, for my two cents: airports need network maps to keep the network chugging along smoothly. Why?
When you have network documentation, you reduce human error. Further, you can use IT network documentation to stay ahead of software updates, licenses, replacements, maintenance, warranties, patches — and to have ready access to specific vendor contact names and numbers (and extensions).
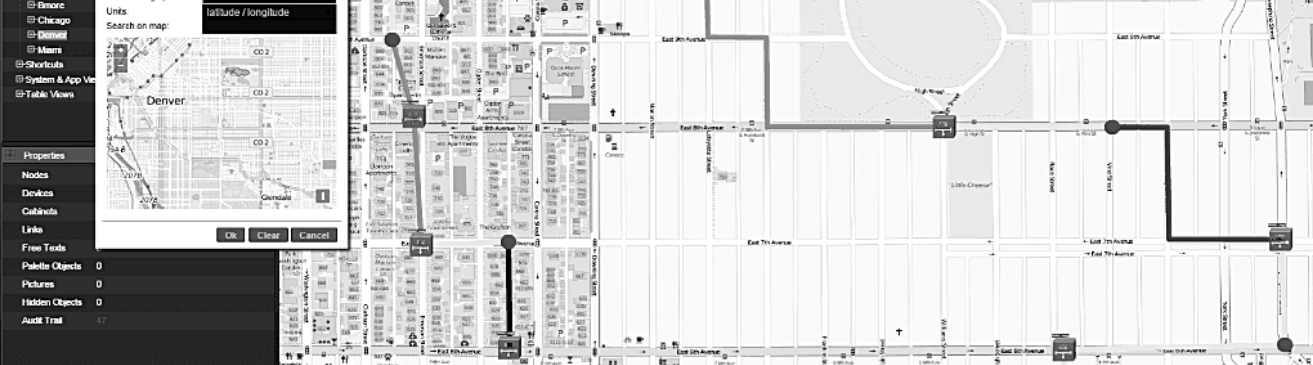
When it comes to preventing network downtime for airports, you have to look at the entire plant’s network — both inside and outside. With GIS-enabled network maps (such as what we offer with netTerrain OSP), you can track everything from fiber splices, handholes, manholes, and GIS-enabled street-level views (with 6-decimal precision) to fiber patch panels inside the buildings.
If you manage an airport’s network, you need to have better information about your network. Here at Graphical Networks, we’ve recently seen an influx from airports wanting to document their outside plant fiber in addition to their inside plant cabling. Given what a complex ecosystem exists at every airport – both large and small – it makes sense to us. From pizza to souvenir shops to nail salons to Lyft, you can find everything at the airport — but you can you find the network information you need when you really need it?