
‘Tis the season…for snowmen, ugly holiday sweater parties, eggnog, and…network headaches.
Aside from genuinely wishing everyone this season “happy holidays” — Happy Holidays to you, and yours! — the team at my company also wants to wish everyone this season the following: ‘Happy Documenting’.
Why?
Because good IT documentation leads to a happier holiday season: fewer fires to put out last minute, less events and parties missed because you’re staying late (again) to fix things, happier colleagues, and IT-dependent business systems that are running smoothly. Now, that sounds like holiday cheer to me…bah humbug!
What do I really want under the tree this year? Peace on earth, health and wealth for everyone…and more awareness of the many benefits of automated network documentation and network diagrams. Yes, really.
Random strangers, my friends, family, ask me what our company Graphical Networks (makers of netTerrain) does and I tell them, “We are a network documentation software company…” Sometimes, if not always, I’m met with a blank stare or an eye roll. I get it: for people not in the spheres of IT and networking, the concept of network diagrams and documentation can be confusing.
So, what is network documentation — and why do I want to get the word out about it?
Wikipedia says, “Network documentation is a form of technical documentation. It is the practice of maintaining records about networks of computers. The documentation is used to give administrators information about how the network should look, perform and where to troubleshoot problems as they occur.”
How do most organizations document their networks? Visio, spreadsheets, or maybe Bob (you know…the guy who has been employed the longest and the data resides in his brain)? How about on a whiteboard?

What types of information can be (…or should be) documented? Network documentation can consist of almost anything, but generally may include items such as hardware assets, network topology maps (showing how things are connected), IP and MAC addresses, etc. For more on this, click here.
Without proper network documentation in place, organizations are left fighting uphill battles:
- Stranded assets
- Poor network planning
- Slower Service deployment
- Slow troubleshooting and Increased downtime
- Increased security risks
- What are network diagrams?
What are network diagrams?
Wikipedia explains network diagrams like this, “A computer network diagram is a schematic depicting the nodes and connections amongst nodes in a computer network or, more generally, any telecommunications network. Computer network diagrams form an important part on network documentation.”
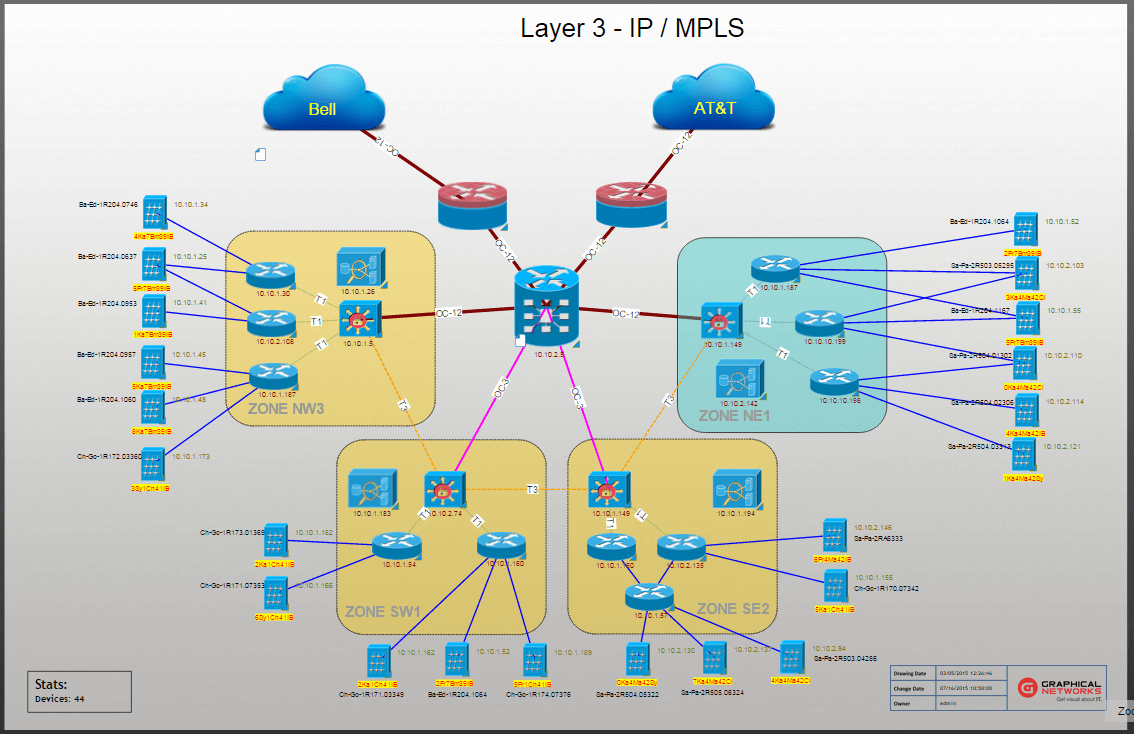 Example of a logical network diagram in netTerrain
You can have many different types of network diagrams, but they are primarily divided into two main types: logical network diagrams (relating to the logical aspects of the network) and physical network diagrams. Within these two main categories, you can (depending on your software’s capabilities), drill down and depict the logical and physical networks in a variety of different ways.
 Example of a physical network diagram in netTerrain, depicting data center racks
Why are automated network documentation and diagrams so important? With so much demand put on the network, from IoT, to the Cloud, and mobile apps…the modern network is in a constant state of evolution.
Unlike Visio, Excel, and Bob’s brain (the ways in which far too many organizations document the network), documentation and diagramming software such as netTerraincan give you an automated way of showing network topology maps, in real-time, and has an alerting mechanism when there is an issue (with email alerting). .
netTerrain can be used as a visual configuration management database (CMDB), to display data from third party applications, such as: AWS, Azure, ServiceNow, Spectrum, and Solarwinds. For more information about the Collector, a standard feature in netTerrain, click here.
With automated network documentation software, network engineers are armed with the real-time network diagrams and network documentation they need to find information quickly to resolve their issue faster. Engineers can even take it a step further and even see their network equipment inside the data center or telecom rooms— and which rack they reside in, and additional fields such as cost, warranty, what’s under maintenance, etc.
Need to see cabling and fiber strands? Check: netTerrain can do that (note: while netTerrain can, not all network diagram/documentation solutions do visualize cabling, etc). netTerrain encompasses not only network mapping and diagrams, but also cable management and fiber/outside plant networks.
Graphical, web-based, and real-time depictions of the network, available in a central repository, helps organizations solve major pain points:
- Improve capacity planning for better network planning and service deployment
- Spend less time in the deployment of the network
- Easily search for information
- Reduce troubleshooting time
- Supplement existing network management systems
To summarize, automated network documentation is key for today’s evolving IT ecosystems and it needs and it needs to be a higher priority project, as the ROI from having proper documentation — and actually being able to understand what’s going on, and act on network insights — is staggering! And, shameless plug here: if your organization has network diagramming, network documentation, network monitoring initiatives for 2020, give netTerrain a try and see if it will meet your needs!
Happy Holidays…and Happy Documenting!