
A network diagram can be anything that visually depicts the network. A basic diagram could show a router or switch, and its connections to other networking equipment. Diagrams can be as simple or complex as you need them to be, and they come in many different shapes, sizes, and flavors.
Some network diagrams may be crudely drawn (think: post-it notes or a coworker trying to explain where something goes). Other diagrams may be highly detailed drawings in Visio. Some are automatically generated, and pulled up on-demand, that reflect the network in its current state.
Manual network documentation can be very time-consuming, inefficient, require constant updates to your spreadsheets or Visio diagrams, and prone to human errors (i.e., forgetting to update the diagrams), which can lead to longer downtime and outages.
All of these network diagrams may show different types of diagrams and topologies — from physical to logical.
So…what is an automated network diagram?
An automated network diagram is a diagram that you generate using software (not an intern and Visio). Using network discovery protocols such as SNMP, the software goes out and discovers the network. It automatically finds your devices and connections — and maps them.
…why do you need automated network diagrams?
Automated network diagrams help to minimize network outages. With automation, the network scanner updates any changes to the network devices automatically: this allows you to see and analyze the impact of an outage immediately.
For network security, these network diagrams can help you detect new and unknown devices in your network and how they connect with other devices. With automated network diagrams, you can help detect and minimize security threats.
What are the advantages of automated network diagrams?
First and foremost, the network diagrams are up-to-date. With automation in place, having updated network diagrams does not require hours of manual data entry. They are also reliable. Instead of hours, having automatically updated network diagrams means it takes mere seconds to access when something goes wrong (no worrying about when the network diagram was last updated).
netTerrain Logical, for example, is an automated network mapping and documentation tool, with device discovery to generate network diagrams of devices and their connections. Simply enter your IP address ranges to scan or define a seed device (typically a core network switch) and hoit scan. Discover your network using SNMP v1-v3, NMAP, WMI, CDP, LLDP, and connectors to VMware, Azure, and AWS.
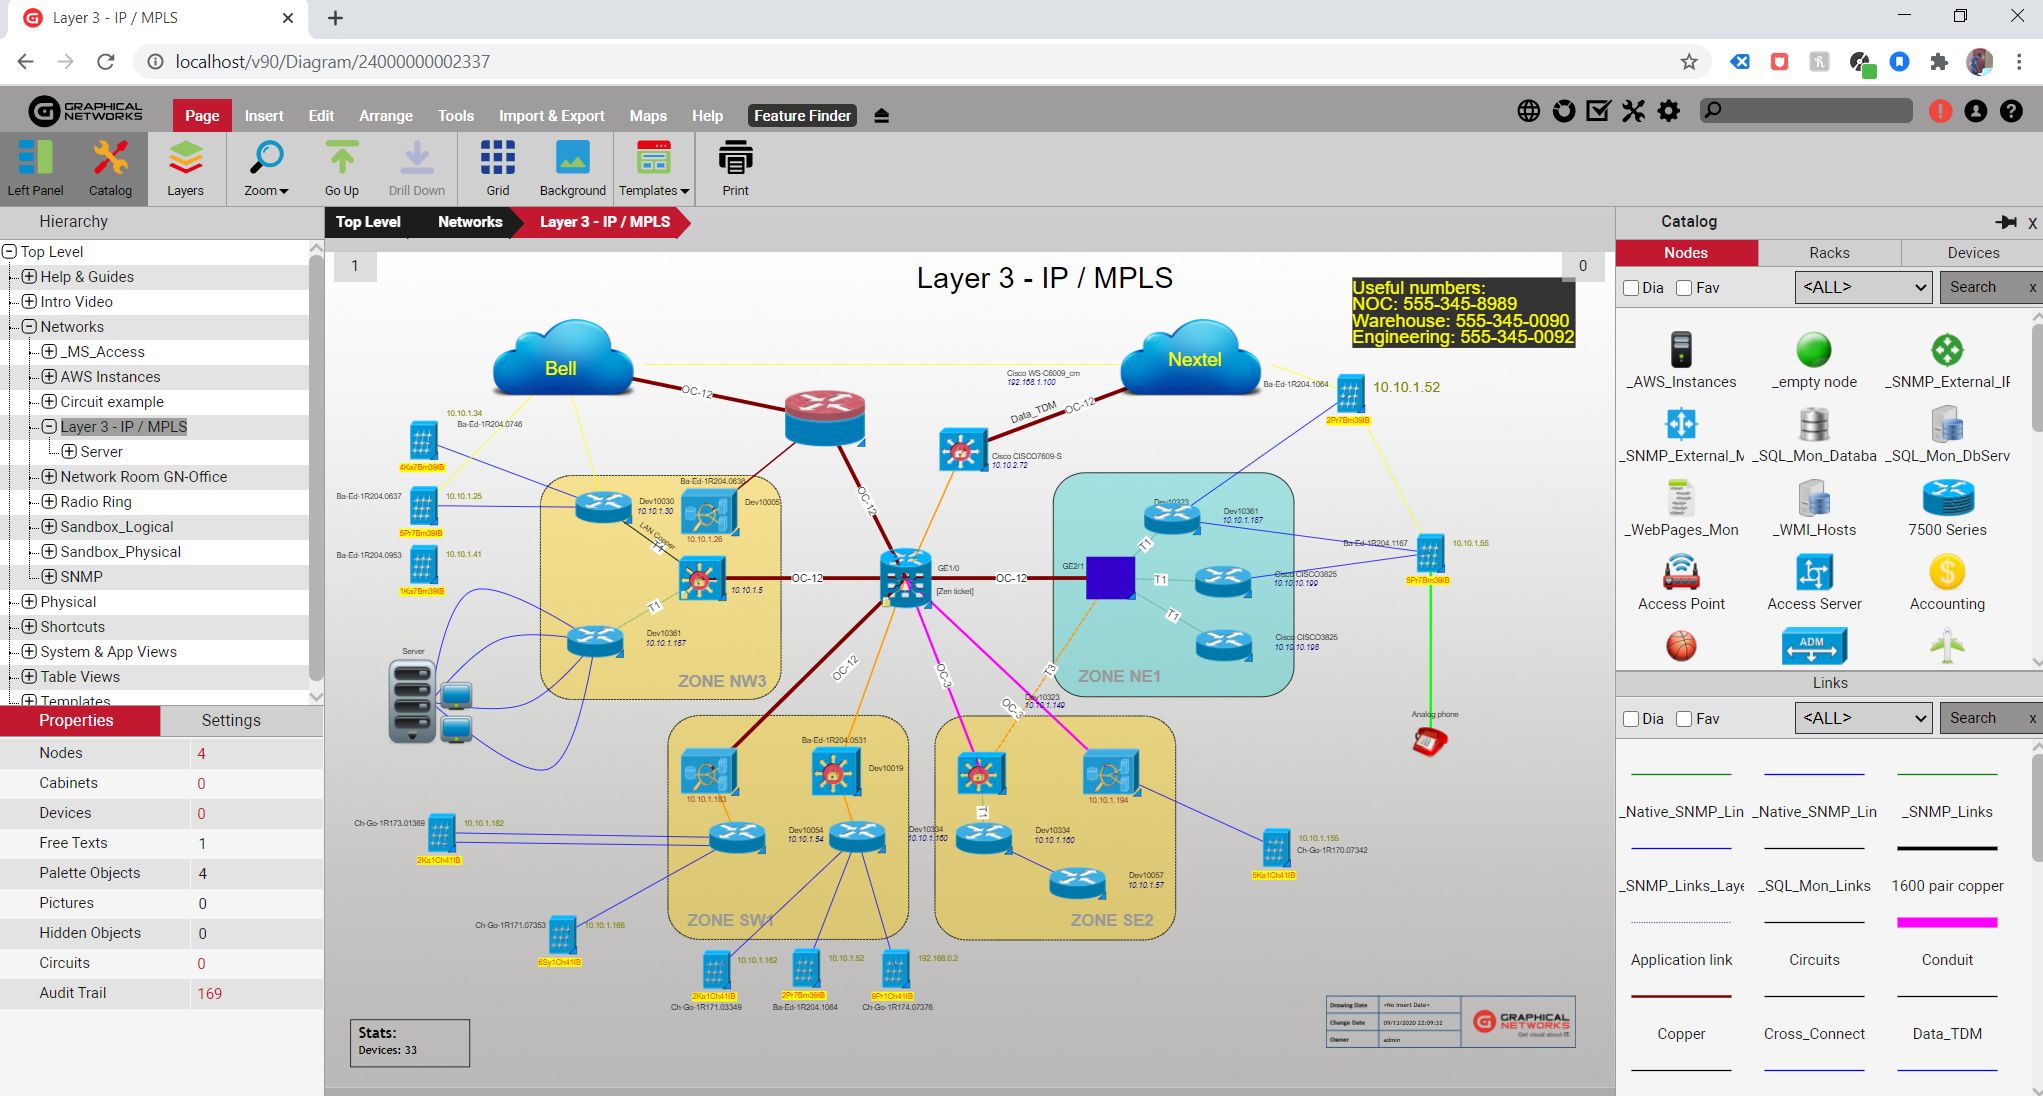 Example of a Logical Network Diagram in netTerrain
You can schedule your discovery through the netTerrain Collector, so you will always get up-to-date network diagrams and eliminate the guessing game on when your spreadsheet and Visio diagram was last updated.
After you have discovered and mapped your network, your netTerrain diagrams can be edited, so you can add other data fields, such as cost, warranty, maintenance, and any other information you like to document. You can even place the network devices in multiple diagrams, like rack diagrams and in office floor plans, too.
Need to run a report to see all of your network assets to show to management? netTerrain provides asset reports and other reports that you can use to help plan for network capacity planning, too.
Want to test drive netTerrain for 14 days – 100% for free, no credit cards required or pushy sales tactics involved? netTerrain can be installed on-premise with a yearly subscription license or a permanent license, or start using netTerrain from day one with netTerrain SaaS. Simply download the netTerrain Collector, enter your IP Address(es), hit scan, and then push your discovery results to your netTerrain Account to view your network maps.