To optimize IT infrastructures, ensure seamless ops, and minimize downtime, today’s organizations are pulling off a high-tech juggling act that’s not for the faint of heart. The need for robust and efficient monitoring and management solutions has become increasingly paramount.
The paradox here is that most monitoring solutions offer little to no visual representation or documentation features (also see: What Network Documentation is NOT). As a result, many IT managers end up juggling one set of tools for monitoring and another for actually documenting their IT infrastructures – great in theory, but complicated when you need to generate an automatic map of Zabbix or start from scratch despite having the info locked away in another system.
In recent years, our documentation/visualization software (netTerrain) added monitoring capabilities (status, environmental monitoring, traps, alerts and more) to address this challenge. So, with netTerrain, you can monitor the status of the network and get automated mapping and visual documentation.
In many cases, however, users that purchase netTerrain in order to have a robust documentation system already have a monitoring system in place — they’re facing juggling two tools. Integrating both of them, instead of juggling them, offers the advantage of not having to rediscover the network with netTerrain (assuming you trust your monitoring system) and more importantly, being able to document the network more or less automatically.
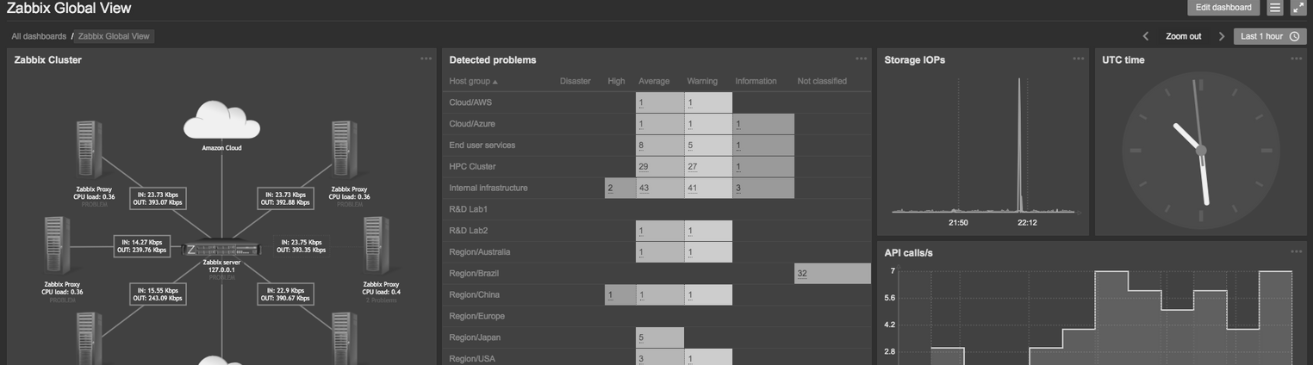
A monitoring tool that’s popular with many of our users is Zabbix.
What is Zabbix?
Zabbix is a monitoring platform designed to monitor the performance and availability of networks, servers, applications, and other IT resources. It collects and analyzes large data sets from multiple platforms like Linux, Windows, and Unix, and can gather information from various network protocols and devices and provides real-time insights and metrics.
Similar to netTerrain, Zabbix supports scalability and distributed monitoring, making it suitable for environments with a large number of devices and complex infrastructures. It can handle thousands of monitored entities, ensuring that organizations can continue to expand and grow without compromising the effectiveness of their monitoring systems.
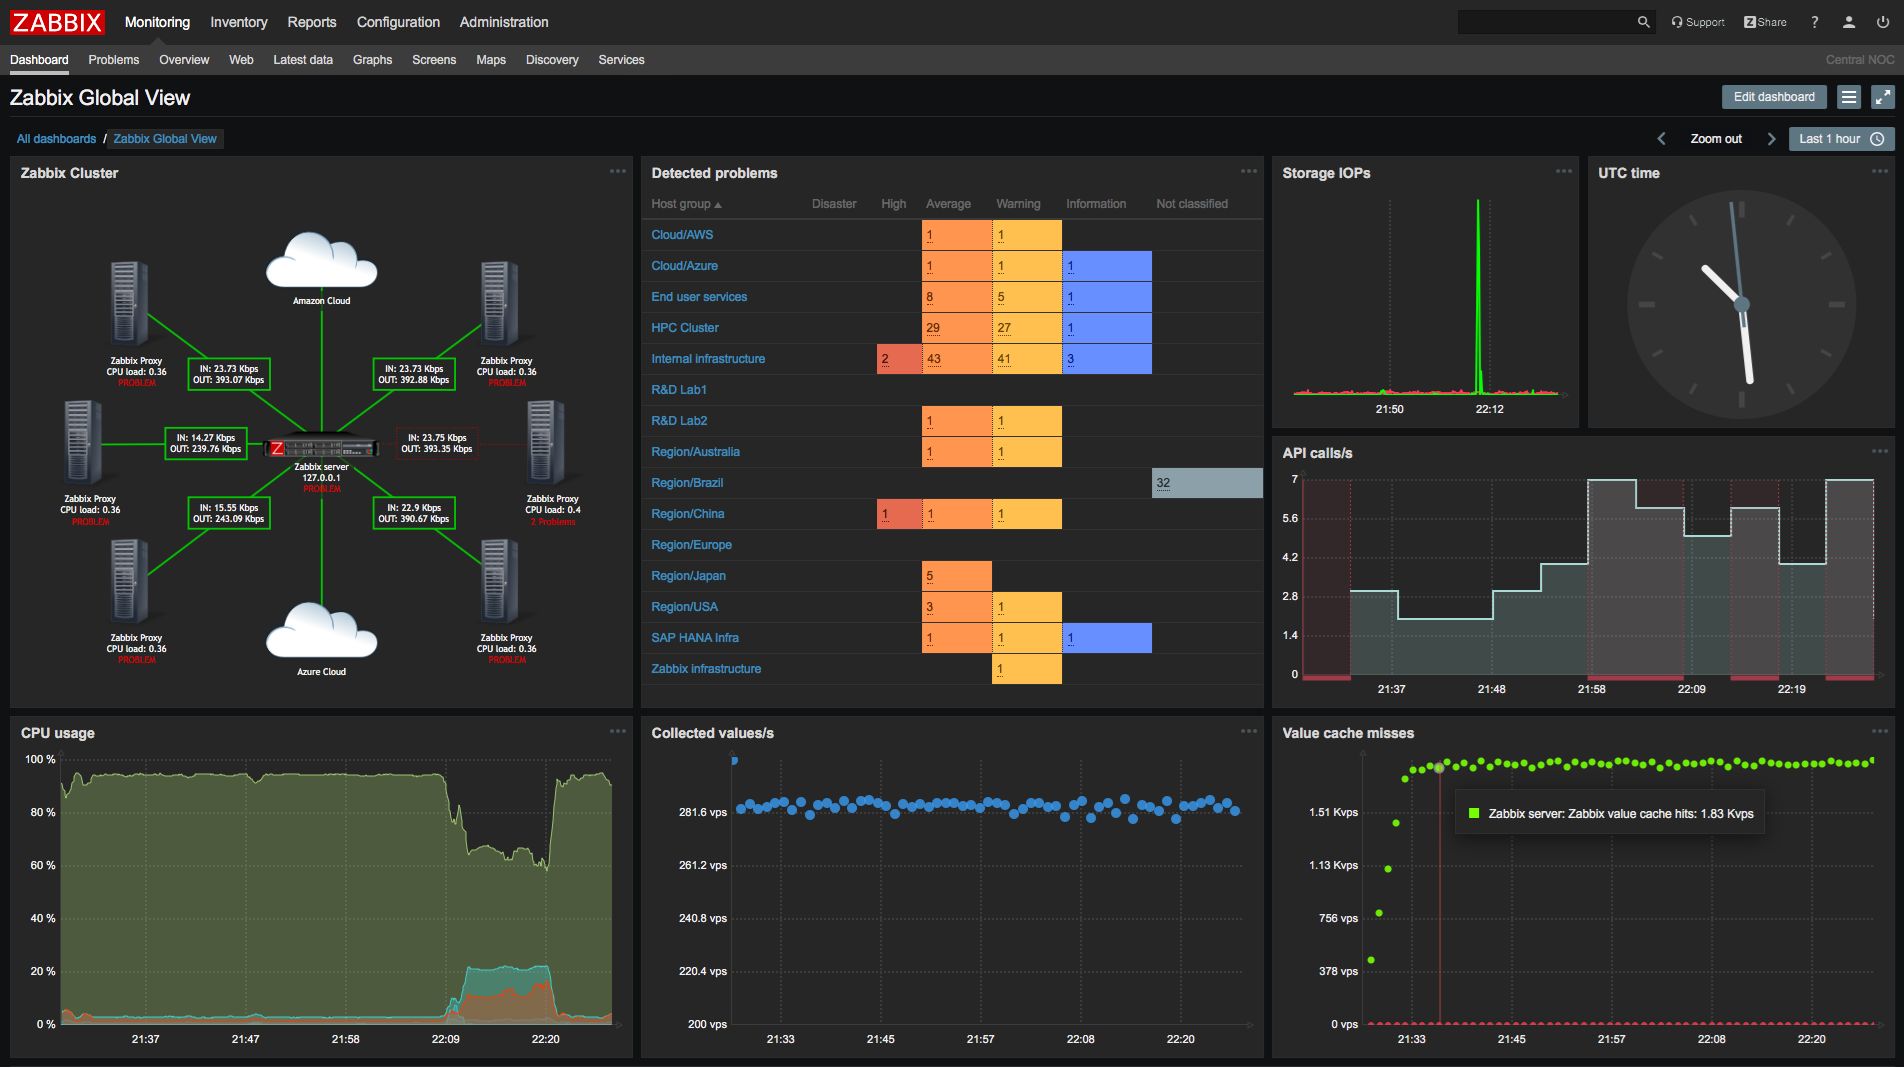
As with most (if not all) traditional monitoring solutions, Zabbix doesn’t have much of a visual representation of the network, except for maybe some attempts at a logical view of the network. It also has no concept of a physical network and the supporting infrastructure, such as racks and floor plan views, data center infrastructure management (DCIM) features, inside and outside plant capabilities, cabling and circuits or the like. It is mostly geared towards monitoring to collect statistics and get notifications and ensure that administrators are promptly alerted about any anomalies or critical events. Users can receive notifications via email, SMS, instant messaging, or even execute custom scripts for automated actions.
Integration Architecture
You can leverage your Zabbix data and automate the creation of feature-rich, beautiful physical and logical diagrams by integrating Zabbix with netTerrain through the so-called netTerrain collector.
Zabbix can be installed on any Linux machine that has access to the network infrastructure and will expose the API automatically.
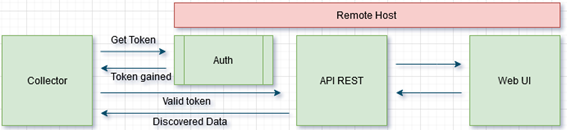
On the netTerrain side, it is the netTerrain collector that does the importing of the Zabbix data via its REST API. The collector must be able to reach the server where Zabbix is located. The collector also needs to be authenticated against Zabbix using an authentication token.
With a valid token the collector then is able to discover the Zabbix data and send it to netTerrain.
A basic data flow architecture is, as follows:
To configure the Zabbix integration, first start the netTerrain collector and then click on the gear icon associated with the Zabbix connector located in the connector list.
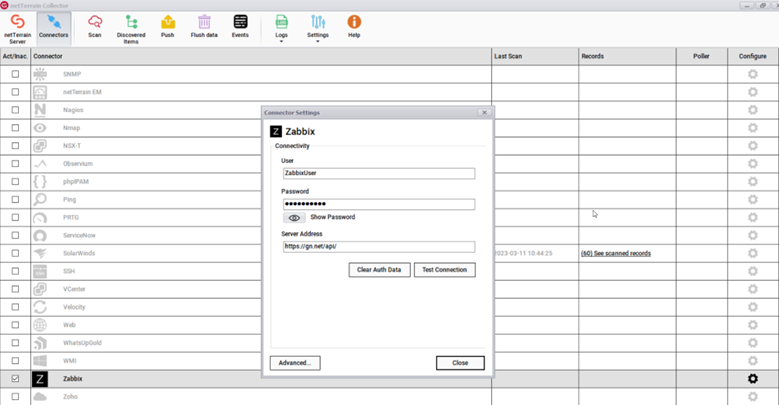 Collector configuration dialog for Zabbix
The Zabbix integration utilizes the REST API needing the following credentials and parameters:
* User
* Password
* Server Address (REST endpoint)
Currently the connector brings in basic data from the list of hosts that Zabbix discovers, along with some default properties which can be edited from the xml configuration file.
These properties include:
* Serviceid
* Ip
* Status
* LastUp
* LastDown
The collector can propagate the status readings into netTerrain so that when Zabbx detects that a device is down, it shows up in red (or blinks, or whatever) in netTerrain. These effects are configured directly in the netTerrain catalog.
What are the main benefits of integrating Zabbix with netTerrain?
As mentioned previously, if you want to document your network properly (and you should!), you would usually either run a network discovery first or enter the network devices and information manually. However, if you already have Zabbix in your network doing discoveries and monitoring then (assuming you trust Zabbix as a source of data) you probably want to avoid to manually recreate the wheel in netTerrain, thus leveraging your Zabbix data and at the same time automating the network documentation process.
To sum up, integrating Zabbix with netTerrain is a huge step forward for network management and documentation. The integration allows for efficient and automated network mapping, bridging the gap between your complex monitoring tools and need for visual network documentation.