Network diagrams, which include both physical and logical diagrams, are a crucial source of truth and actionable information in a well-documented network. Because they show the components of a network and how they are connected, they’re a visual way to understand IT networks.
Logical network diagrams show network engineers and administrators how information flows through a network and how devices communicate with each other. This includes subnets, network devices, and routing protocols. They can be drawn manually or using software such as Visio, but they’re easiest to draw and most useful when you use an automated network mapping solution (such as netTerrain) that uses real-time information.
In this blog article, we’ll check out three of the most common use cases for logical network diagrams.
Use Case: You Want to Fix, Click, Go Home Early
You’re probably familiar with a scenario like this: you’re about to go home on time, make it to your kid’s soccer game…and then bam: the phones start ringing. Something’s down, and you’ve got to fix it.
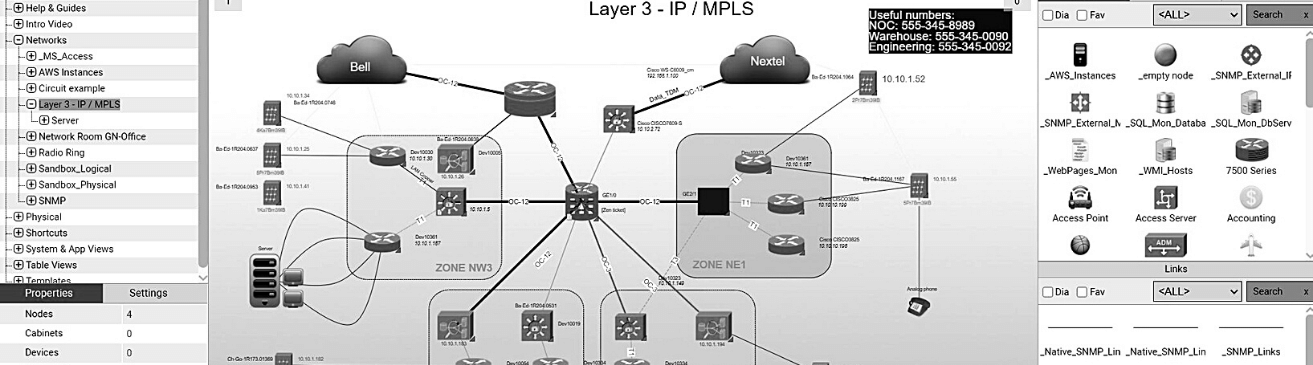
Having easy-to-access and real-time logical diagrams from one centralized platform gives you the actionable insights you need to fix issues that pop up. netTerrain’s network discovery and polling statuses, for example, allow you to quickly identify issues and see what’s impacted. You can find information about any device or connections in seconds using netTerrain’s search function. You can run a circuit layout record to understand exactly how devices are connected.
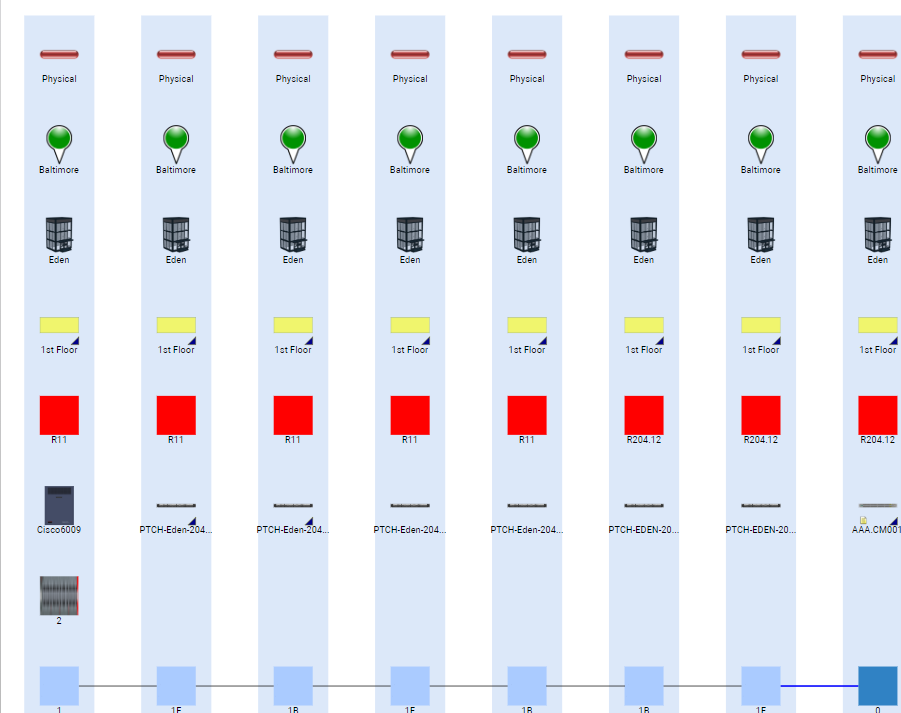 Network Diagram Example: Circuit Layout Record
Use Case: You Want to Reduce Risks
You can’t secure your entrances and exits if you don’t know where they are. Logical network diagrams allow you to visualize your entire network. When you can visualize what you have, where it is, and how everything connects, you can identify and secure your exits/entrances. You can also gain visibility of web-accessible systems: discover and document the various applications that are running on your infrastructure and any applications and servers that are facing out to the world.
What about ensuring your equipment stays up-to-date with the latest security patches? If you don’t have a thorough understanding of what you have, ensuring it’s up-to-date is nearly impossible. Logical network diagrams, that you can drill down into, when was the last discovery, and the ability to add your own data fields to track moreITAM information, such as vendor information, warranty, cost, license numbers, and more.
Use Case: You Want to Save Money
When you don’t know what you have, you can’t manage it. Logical diagrams allow you to visualize your IT assets and gain greater control and governance. With visibility into your infrastructure, you can meet (and improve) service level agreements (SLAs) with faster troubleshooting and less downtime (which gets expensive). You can identify unused assets and reduce unnecessary IT spending.
These are just three use cases to justify the need for an automated network documentation solution, like netTerrain Logical. As I have mentioned many times, network documentation/network mapping should be one of your higher priority projects for 2021. The benefits outweigh the cost and then some. To see how fast you can discover your network, please contact netTerrain Sales for a free test-drive and to see your network diagrams — in literally minutes.