 Before we deconstruct the loaded title of this blog — ‘DCIM PUE and alternative facts’ — let’s first remove any mutual mystification around these two acronyms: PUE and DCIM. Or at least, let’s try…
PUE stands for ‘Power Usage Effectiveness’. It measures the total amount of energy used by a data center to the total amount of energy delivered to the computing equipment in the data center. PUE was developed by The Green Grid consortium and released as a global standard in 2016. The ideal PUE for data centers is 1.0 (note:the PUE number can’t be less than 1, unless you can somehow violate the laws of thermodynamics, however it should be as close to 1 as possible).
The PUE standard was released to address a growing problem: out-of-control energy consumption by data center equipment. In 2014, the U.S. Department of Energy’s Lawrence Berkeley National Laboratory released a report showing that data centers then used an estimated 70 billion kilowatt-hours that year — in other words, an amount equivalent to how much all of the homes in the states of Virginia and Washington states use in a year. To address the issue, U.S. federal data centers are required to use DCIM to lower PUE to a rate of 1.5 or better.
DCIM stands for ‘Data Center Infrastructure Management’. I’ll assume that, if you’re reading this, you probably have a good idea of what that is. If you’d like a refresher, the intro to our series on Choosing the Right DCIM Solution is an excellent primer.
Now that we’ve gone over what PUE and DCIM stand for — I’ve got a tale to tell about an interesting request we recently received: a prospect wanted to show a PUE report in netTerrain DCIM. Sounds fairly mundane at first, but things got interesting fast…
The prospect actually wanted to modify a PUE report so that it could represent the PUE based on static values (since we already show PUE readings based on actual power usage monitoring). Yep, you read that right: static values.
Of course, we asked the obvious question: “what exactly are we representing here? I mean, we are monitoring something, right?”
Nope. No IPMI, SNMP, or any other protocol was going to be enabled.
If you are baffled, well, so were we! How on earth could we show PUE if nothing is actually monitoring the infrastructure? I mean, the M in DCIM may as well stand for monitoring!
The prospect responded that they wanted to show a proof of concept to the final client on the principle of PUE measurements — but without having to monitor anything, because that would mean setting up some network management capabilities.
This should be done be simply plugging in static values into the PUE formula — that formula being: PUE = 1 + (Non IT Power / Total IT power).
Our next question was this: “ok, so which static values are we going to plug in?”
The total Non IT Power would be supplied as a manual entry value point at the data center level; the total IT Power would be obtained from the nameplate power specs of each rack mounted device, as we can see in the image below:
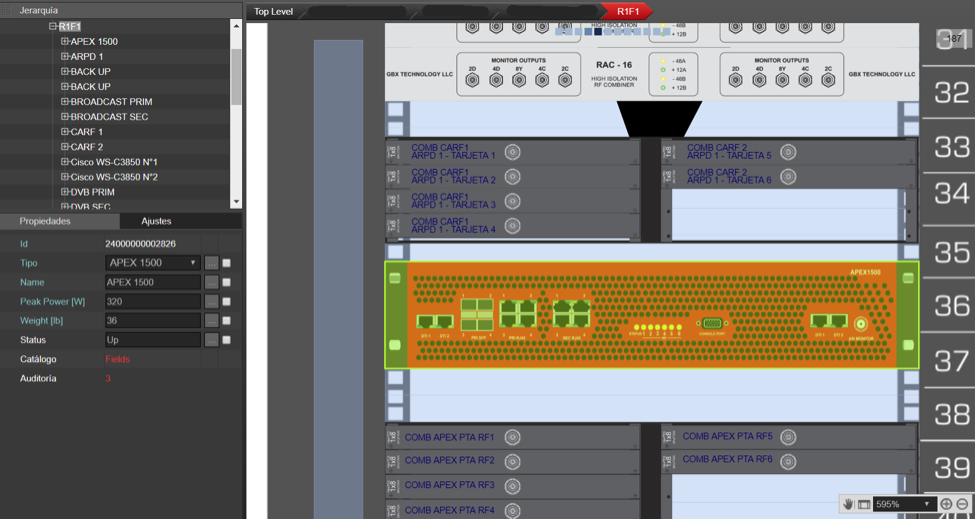 Static nameplate power for a rack mounted device in the DCIM system
As adding a custom field to netTerrain is very easy, a field called “Non_IT_POWER” was simply added to the object “Site” (which basically represents each data center).
The value for each site was then manually added:
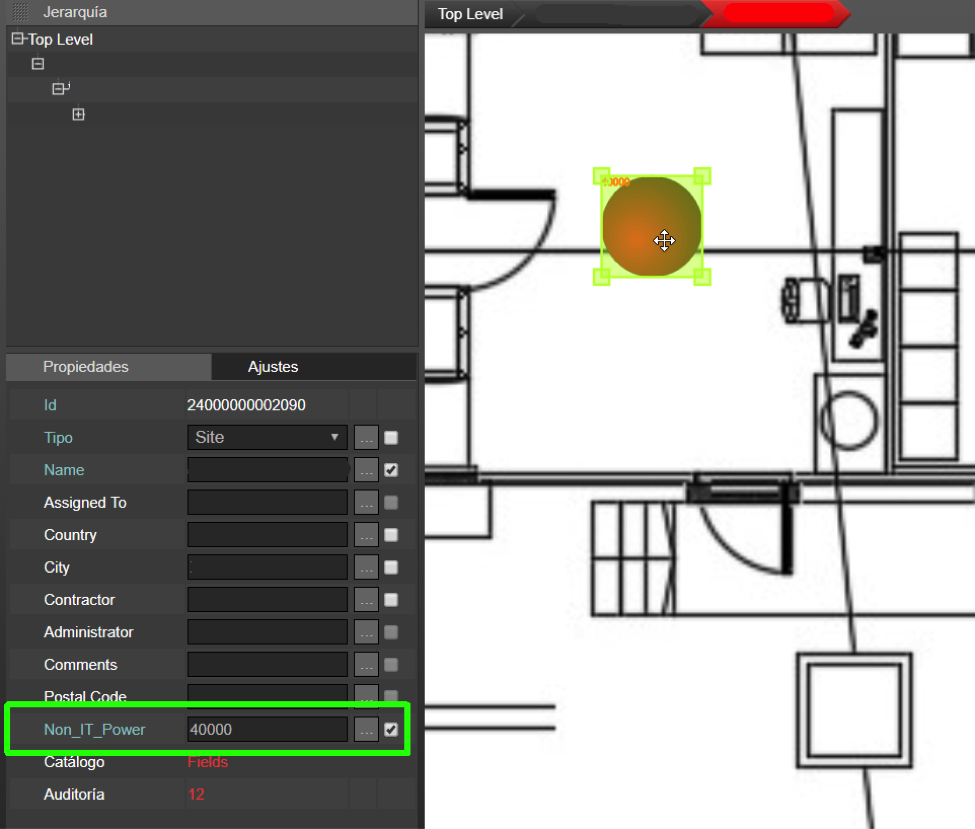 Non IT Power statically added to the diagram
All the IT equipment types already had a field called Nameplate Power, populated with the values from the netTerrain catalog. The total formula was calculated as the sum of all ‘NON_IT_POWER’ for all sites divided by the sum of all the IT Equipment Nameplate power.
Yes, this all looks quite iffy, but remember it was just a POC. And hey, at least the ‘1’ in the formula would be accurate .
Now, as that Non IT Power value changes dynamically in real life (which netTerrain can monitor), it’s a problem if the value is statically injected. But really: the worst offender here is the static Total IT Power calculation.
For starters, using nameplate power is never accurate. If anything, one should apply some derated power. Further, one should categorize which equipment actually contributes to that total IT Power.
And herein lies the conundrum of PUE: if you use derated power, or much better, real power, you’ll realize that you are consuming less power than your nameplate power values indicates (which is supposed to be good) — yet, your PUE goes up (which is bad)!
In the end, the PUE was 3.55 (as the ideal PUE is 1,0, 3.55 is not great, of course) but our prospect was happy that they could still present the concept to the end customer without having to configure anything.
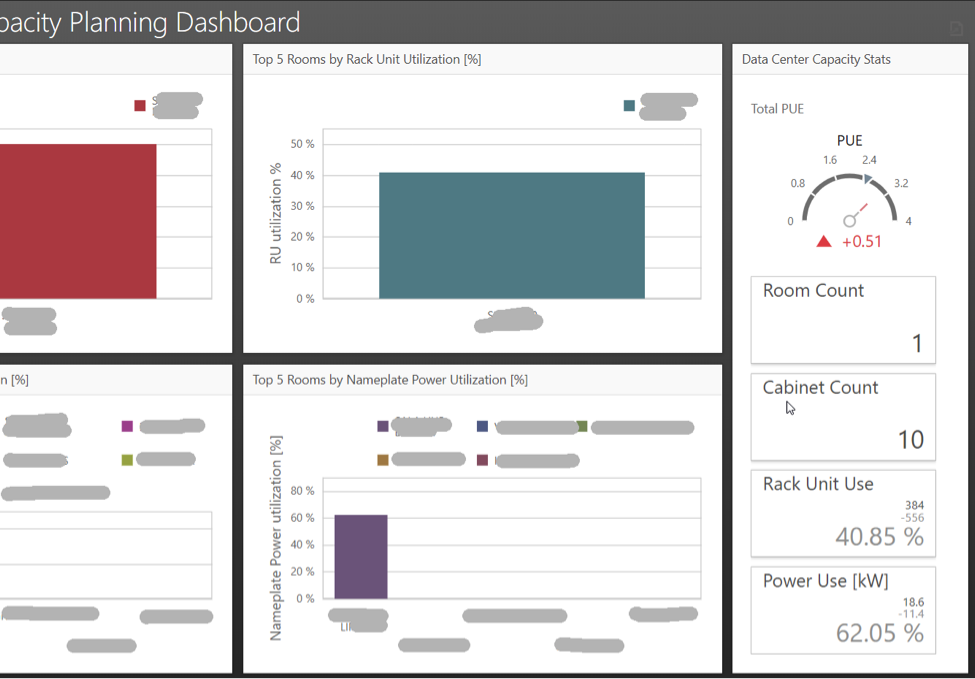
In an upcoming blog, we’ll touch upon the overall controversies of PUE; for now, however, we’ll leave you with this final screenshot of that beautiful PUE reading (note the top right corner)!
Alternative facts, anybody?