
In this 4th segment (and video) of our series on managing your outside plant with dynamic maps, you will learn to trace a cable in our outside plant software netTerrain.
In the previous segments in this OSP series, you learned how to: create a map in netTerrain OSP software, how to add objects to it (buildings, manholes, handholes, conduits, ducts, etc), and lay everything out. Now, you’ll learn how to inspect an individual cable.
Tracing Circuits with Dynamic Outside Plant Maps: Introduction
What kind of cable can you trace? Anything at all: it could be a fiber cable, a copper cable, or even a circuit. In this segment, you’ll also get a glimpse of how netTerrain Outside Plant software also helps you manage your inside plant: we will give you a look into a couple of the buildings you’ve seen on our maps.
netTerrain OSP includes inside plant management for one simple reason: networks need to be managed not only from the perspective of the outside plant but will, almost always, include some inside plant elements that need depiction.
The inside plant components can be from a small set of points of pre-sets — or maybe a couple racks here and there or some loose equipment — and can scale all the way up to large data centers.
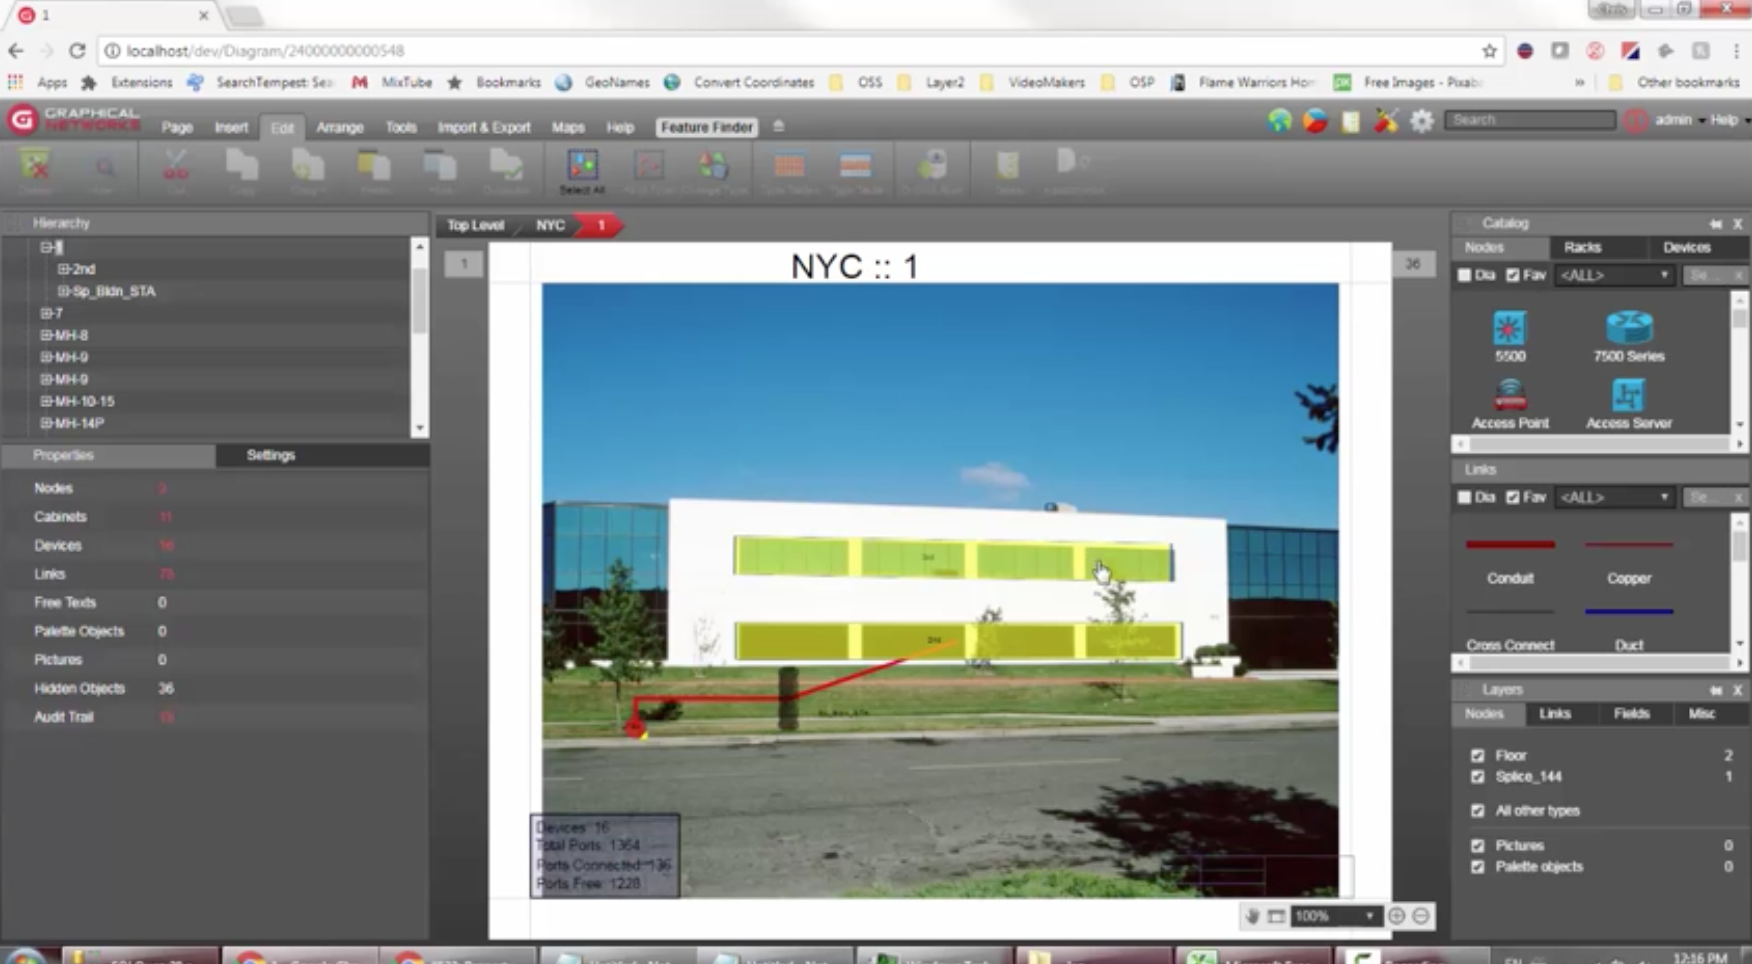
Let’s drill down into one of these buildings and see what we have. While some of our outside plant customers choose to show a picture of the building itself — sometimes with some of the floors, etc. — we won’t need to go into every single detail of all the things you can do in terms of inside plant. If you want to explore more of what we can do with our inside plant documentation, we have numerous resources available to you around our DCIM software.
In this example, we’ll just glance at the inside plant depictions in this current project so that you can understand how you can trace an entire circuit — inside to outside — when needed.
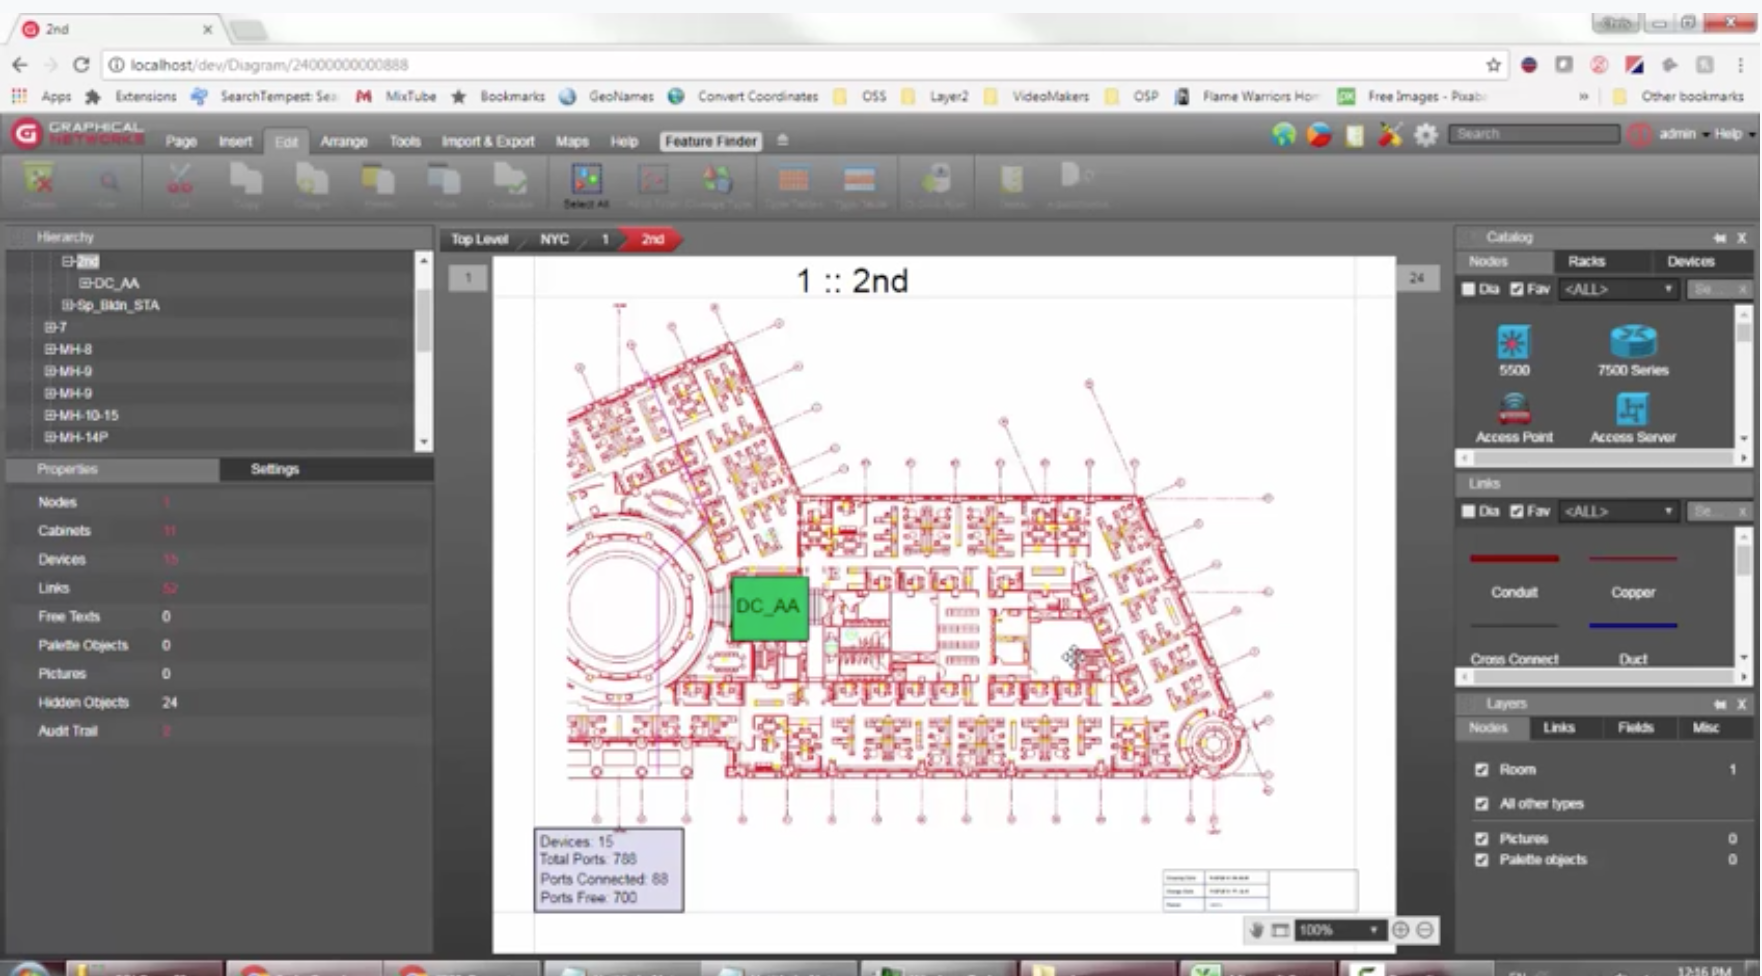
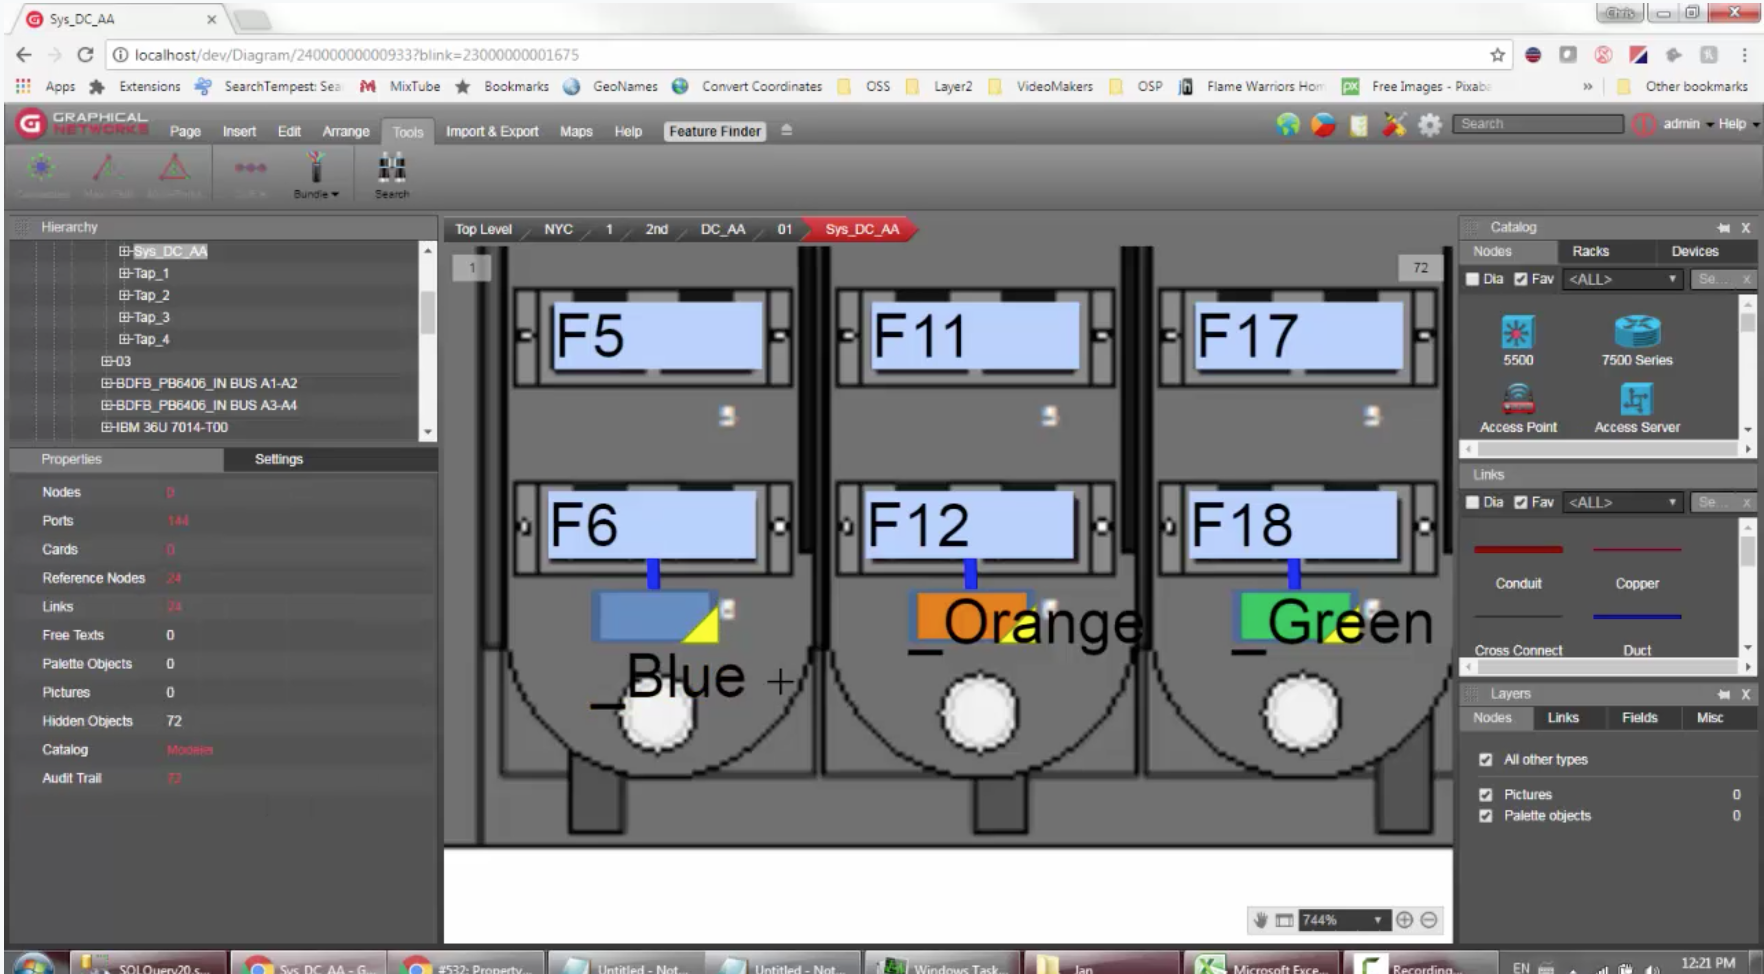
Let’s drill down from the floorplan view to a specific room view: so, for example, below you can see that we’ve got some racks here going from the floorplan view to a specific room view: we have some racks here (and, just to note, the hierarchy we are navigating is not mandatory: you can build your own hierarchy). Note: you can also see exactly how this works by clicking here to watch the video.
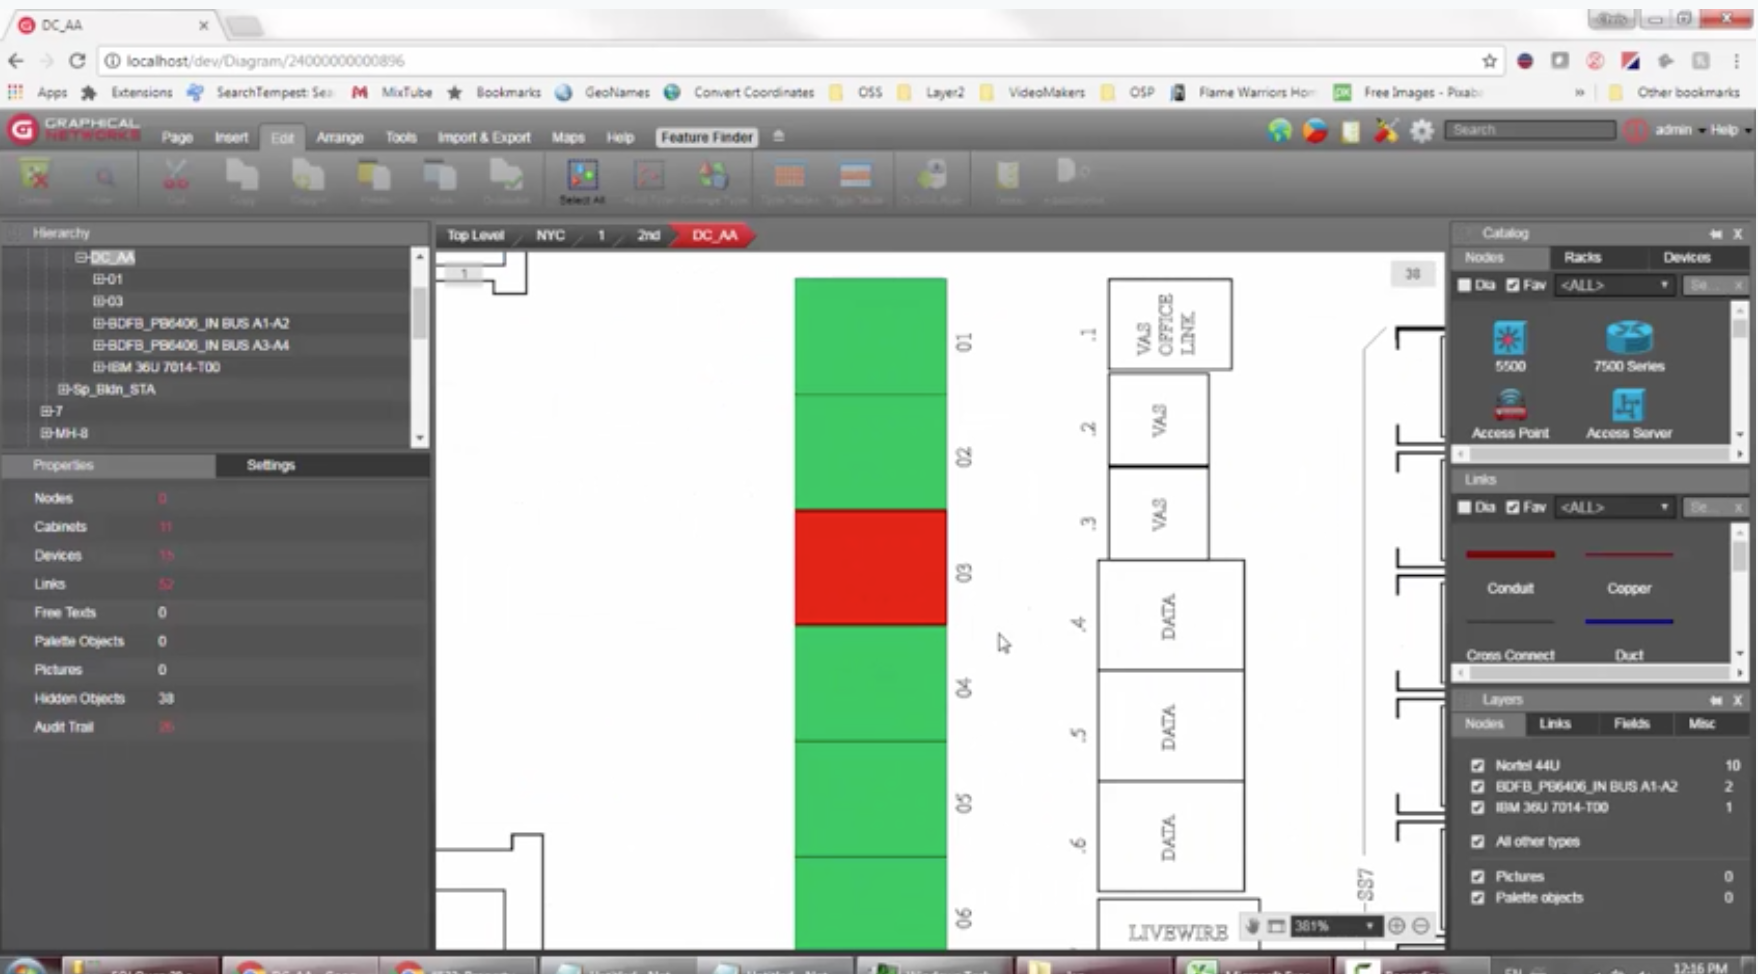
You can color code the racks based on different criteria (again, we won’t go into the details of all of the things that you can do with netTerrain DCIM) but in this example, we do want to know about some of the equipment here because the circuits will start and end on actual devices that are in the inside plant.
The circuits will traverse the outside plant and that’s what we will trace here. Many software solutions will give you inside plant documentation (aka data center inventory) in one tool — and outside plant in another tool: keeping the two silos separate.
The problem with this method, however, is that when it’s time to trace a cable, it can become messy. Here’s why:
- It’s either missing some of the ports (the inside plant stuff)
- they have to create it manually
- or it becomes very complicated maybe they have some sort of in-house tool or something that creates the trace.
The result is usually something like a blob diagram or maybe just some text.
Tracing Circuits with Dynamic Outside Plant Maps: What are Circuit Layout Records?
In netTerrain, we have something called the Circuit Layout Record (CLR) that solves this problem. We use the CLR to actually trace a circuit, This is how we actually trace a circuit, in general, in netTerrain — so our customers, once they have their circuits of their cables all connected — then they launch one of these CLR’s and that is how they can find out how that cable, or that circuit, traverses from A to Z — including all of the hubs in between.
Tracing Circuits with Dynamic Outside Plant Maps: How to Launch a CLR
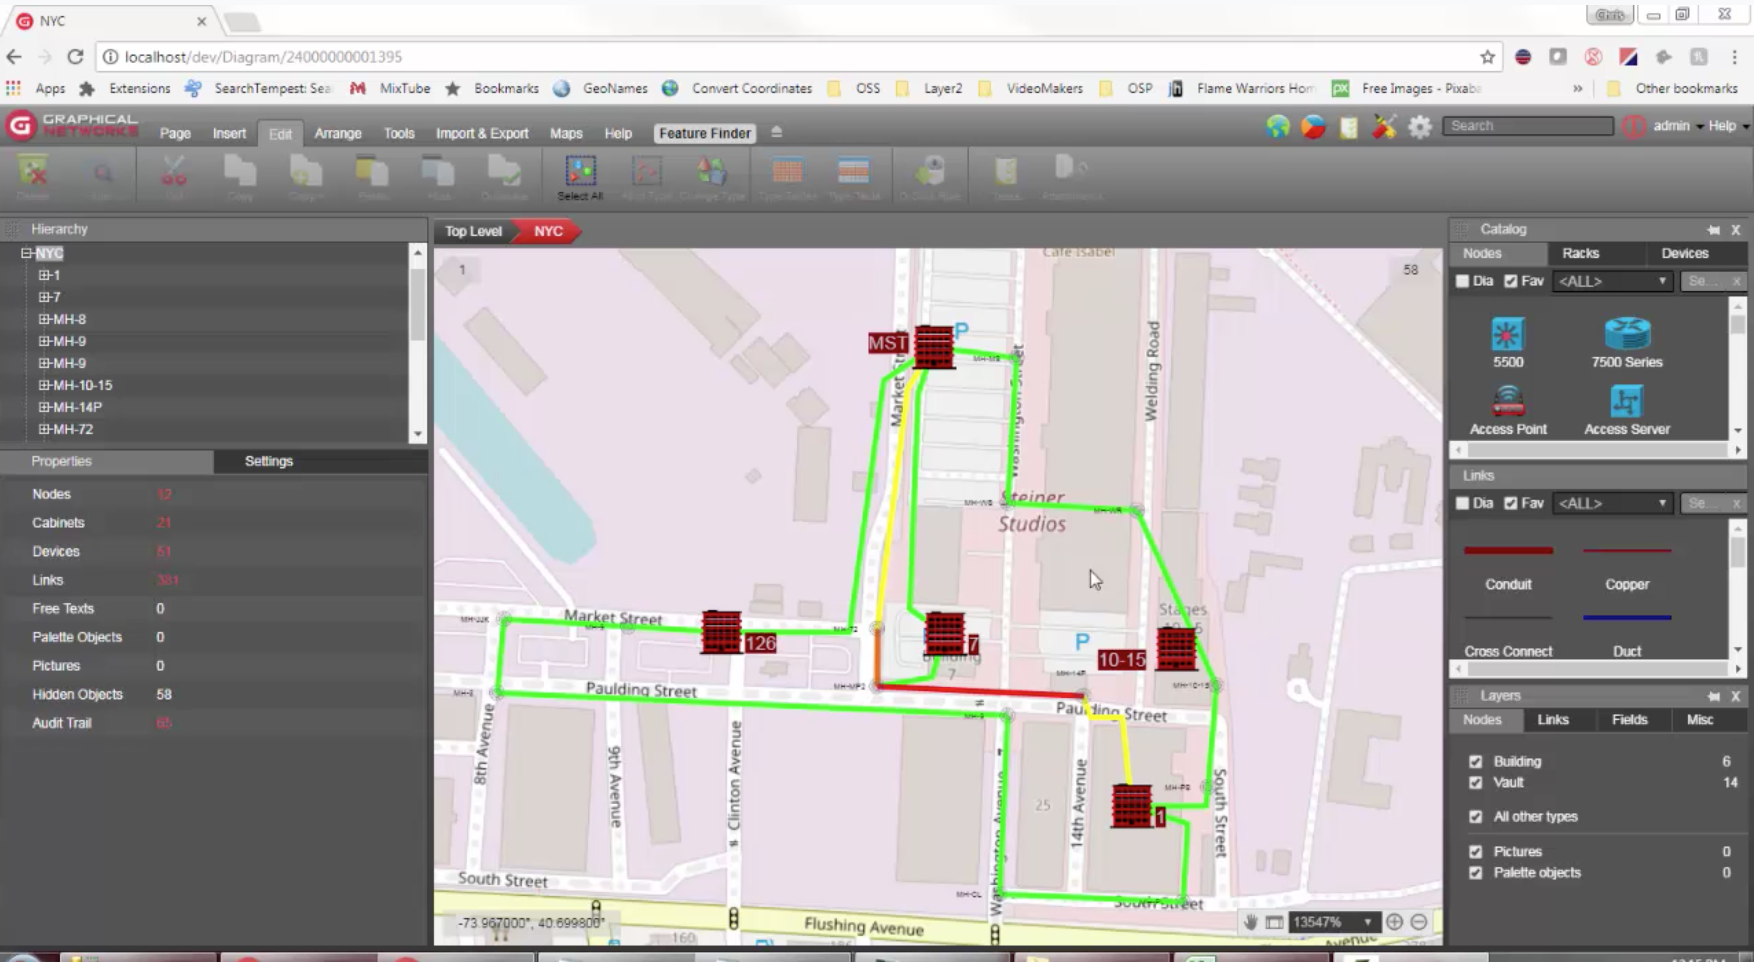
So how do we launch a CLR in netTerrain? You can launch one from anywhere in your entire project — and from any part of your circuit. Below, you can see we have a card for a router and 12 cables which have traversed all the way to the other end.
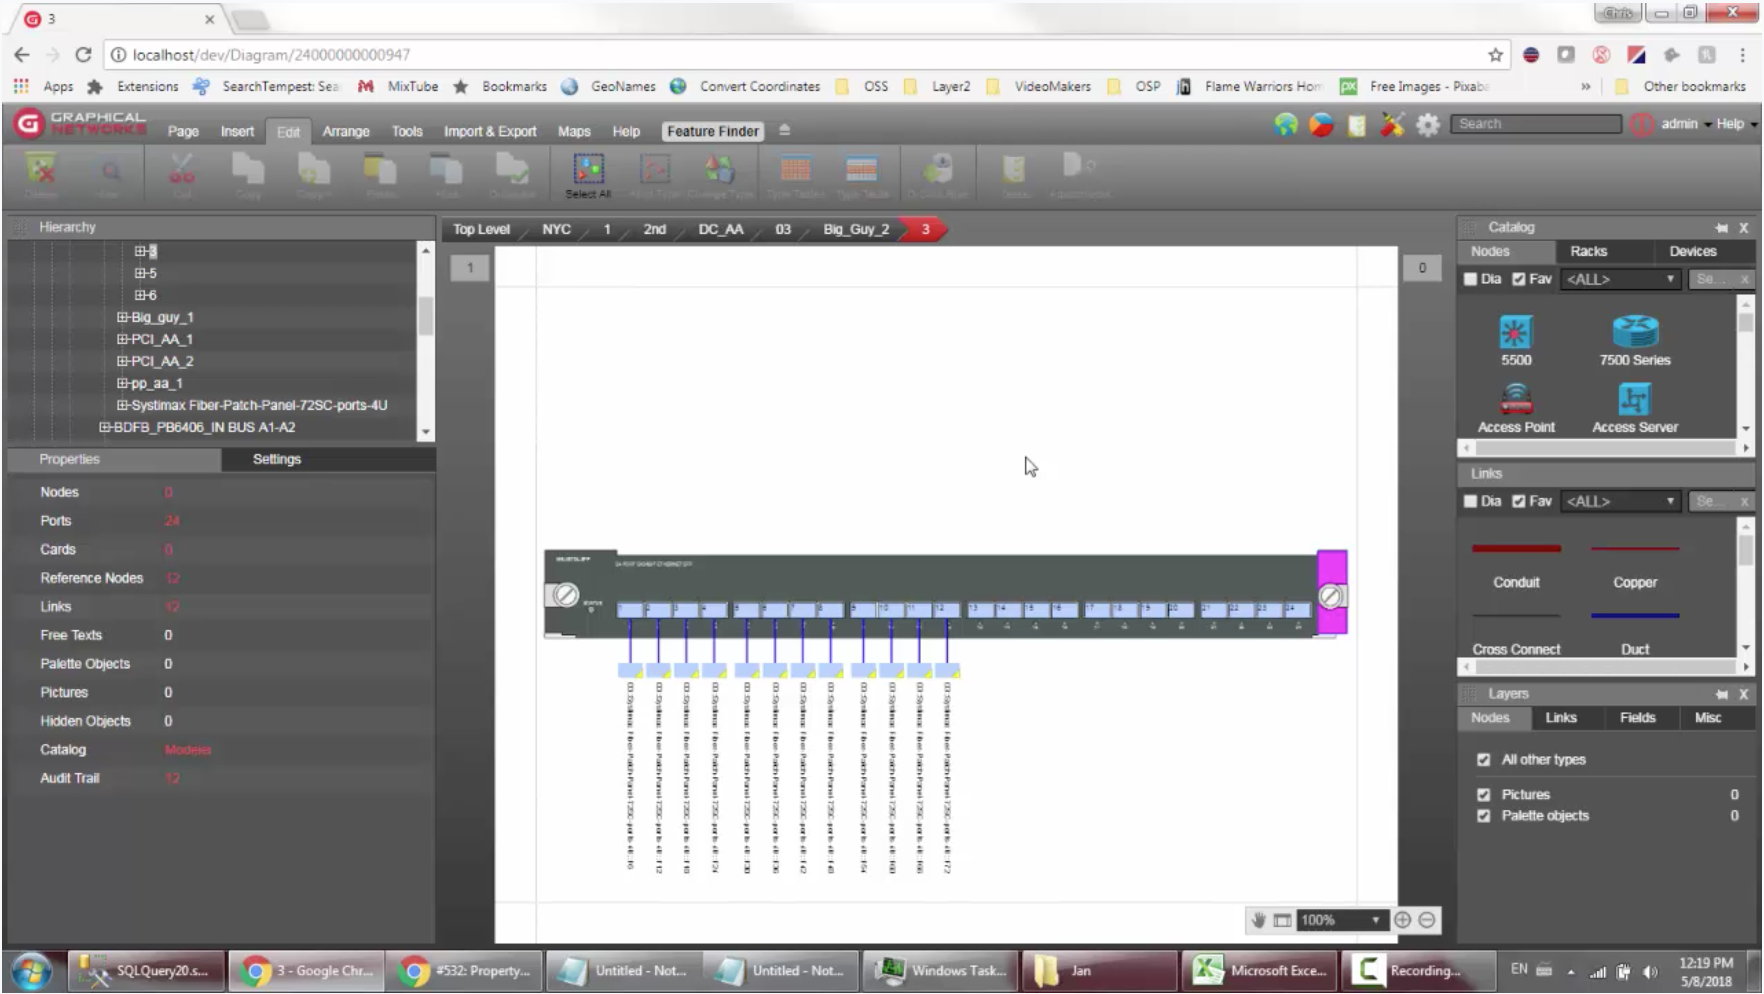
Just right-click on the port and you can launch the CLR from here; you can also just double-click on the particular cable itself and it will launch the CLR.
Tracing Circuits with Dynamic Outside Plant Maps: Traversing the Hierarchy
This CLR is quite large: it has a large number of hops. There is no limit on the number of hops, however, these diagrams can become long. To make it easier to view a long diagram, you can export it using a tableview.
We started the CLR from the left side: below, you can see that we’re at one end here for port ‘1’ on card ‘3’.
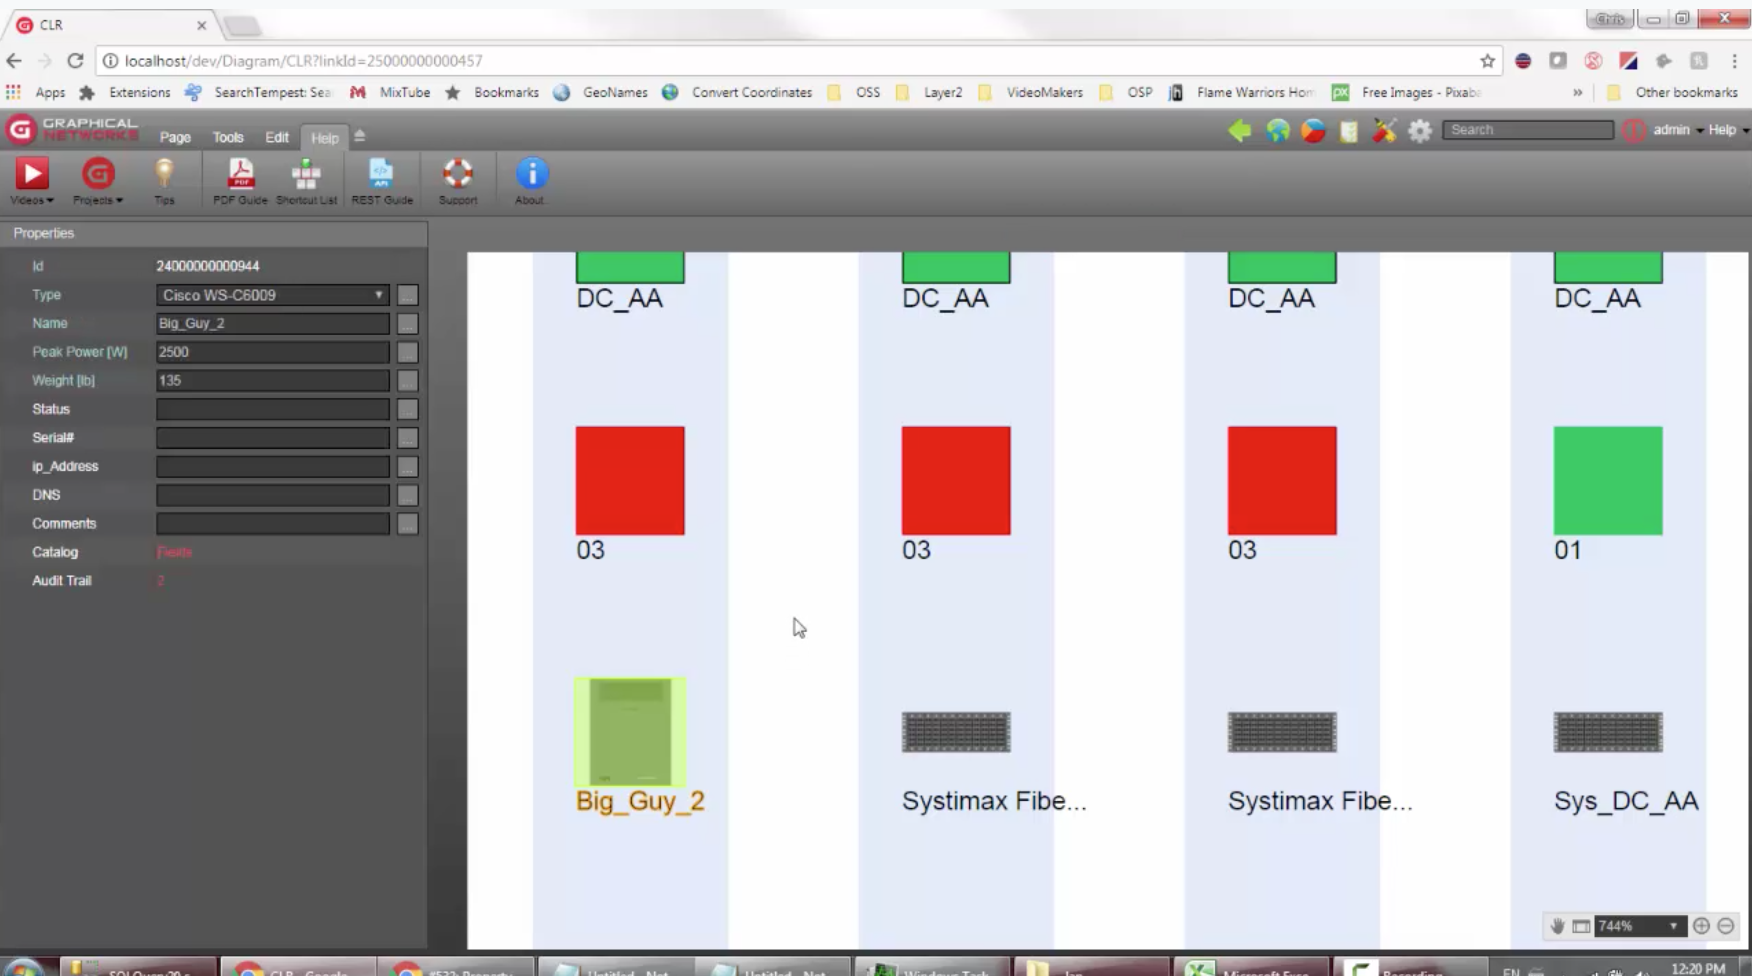
‘Big Guy 2’ is our router on rack ‘3’: DC_AA is in our building #1 NYC – we’ll make a jump, aka a hop, to port ‘F-6’ on this fiber patch panel (to see this in the video, just skip ahead to 5:50 minutes in).
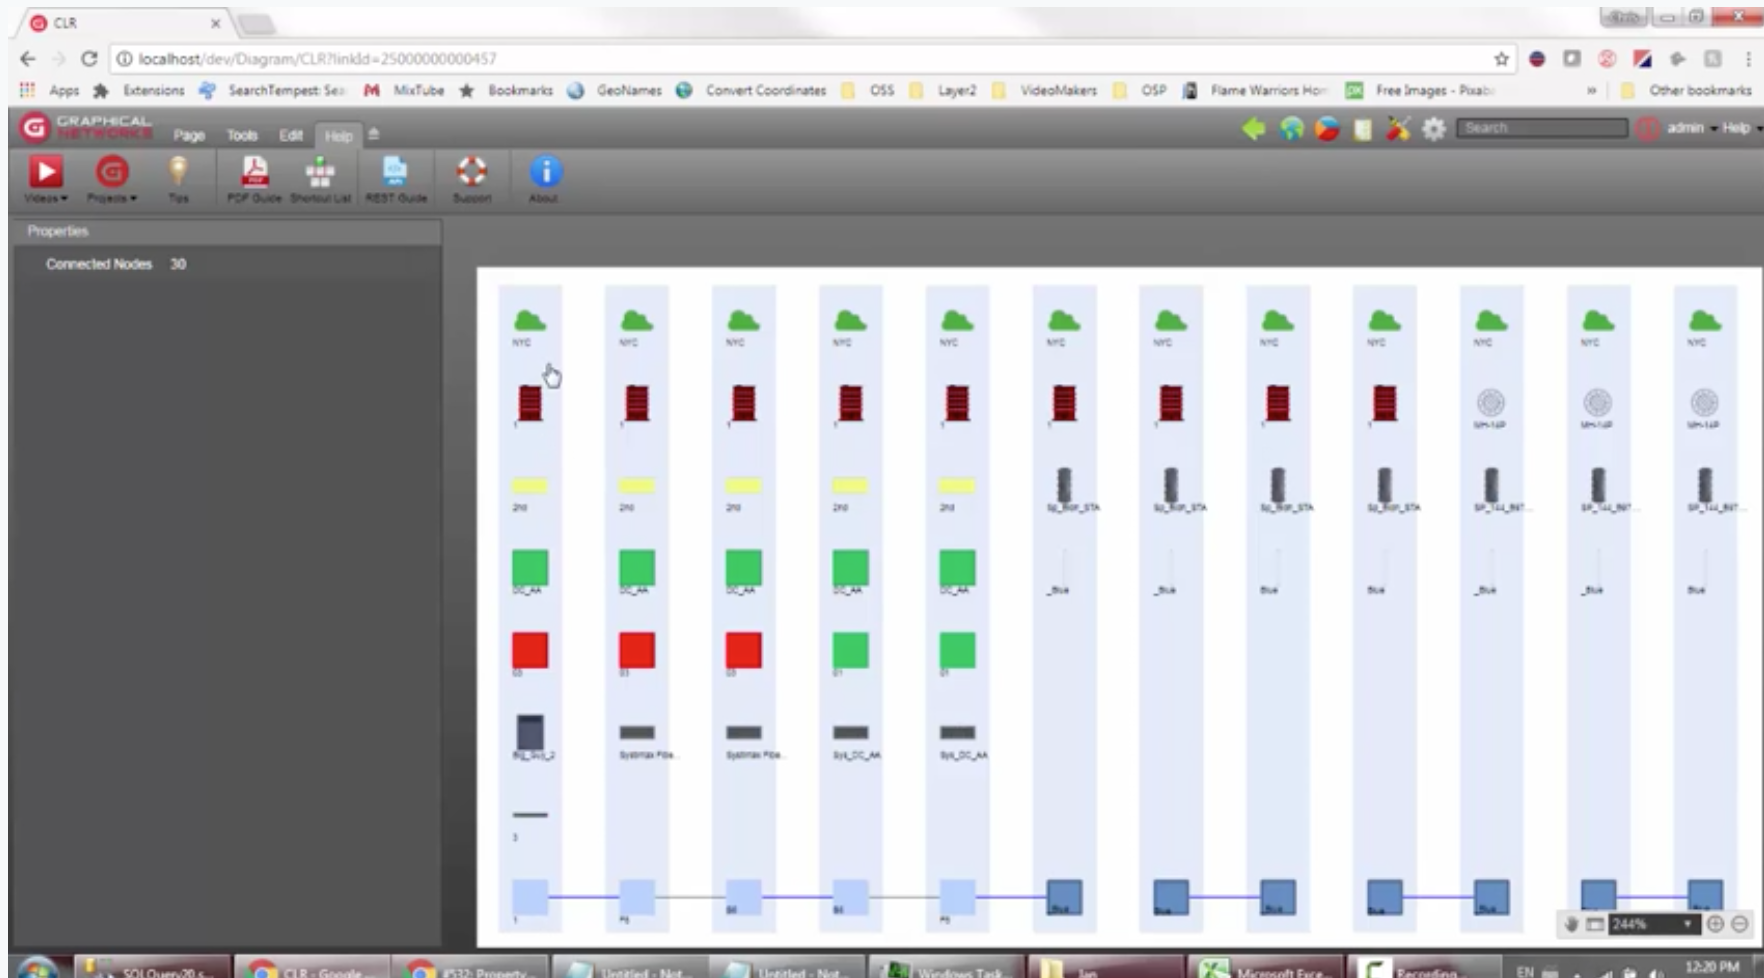
If you go up, you have the hierarchy: go to the right, and you have each hop. As you can see, this is pretty simple to read and it also gives you an added advantage: if, at any point, you want to inspect a particular component in your CLR, just double-click on it and that takes you to the project where the specific component lives. For example: double-click on port ‘F6’ and it takes you to the project to port ‘F6’ for that particular fiber distribution panel.
Here you can see ‘F6’ that is connected to a port in some other part of the project. You can actually navigate this same circuit simply by traversing the hierarchy in netTerrain itself: you start hopping from one end to the next over to here (and so on). You quickly see, however, that if you do that, you could very easily get lost. This is where the CLR plays a vital role: it gives you, in one simple and single view, the entire trace for the circuit – from A to Z.
Tracing Circuits with Dynamic Outside Plant Maps: Putting it All Together
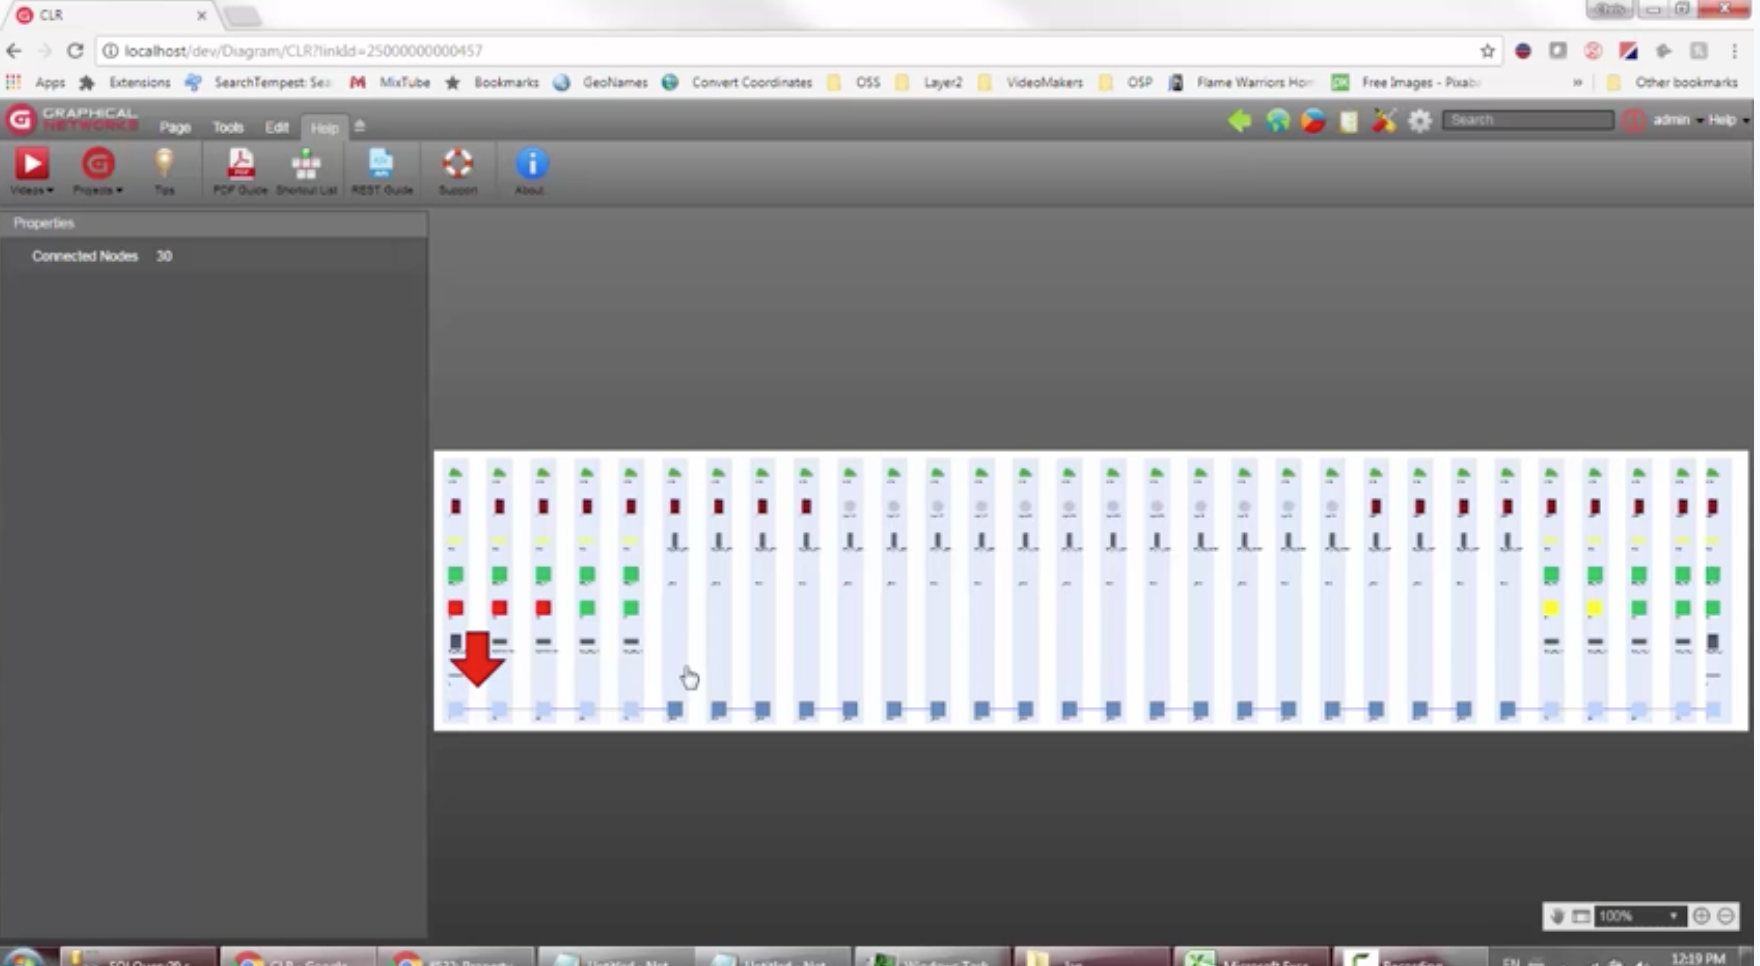
Let’s go back to the CLR. This is important: when you’re dealing with both inside and outside plant in netTerrain, you can see that in the CLR itself there is a gap here. This gap (see below) will be the outside plant.
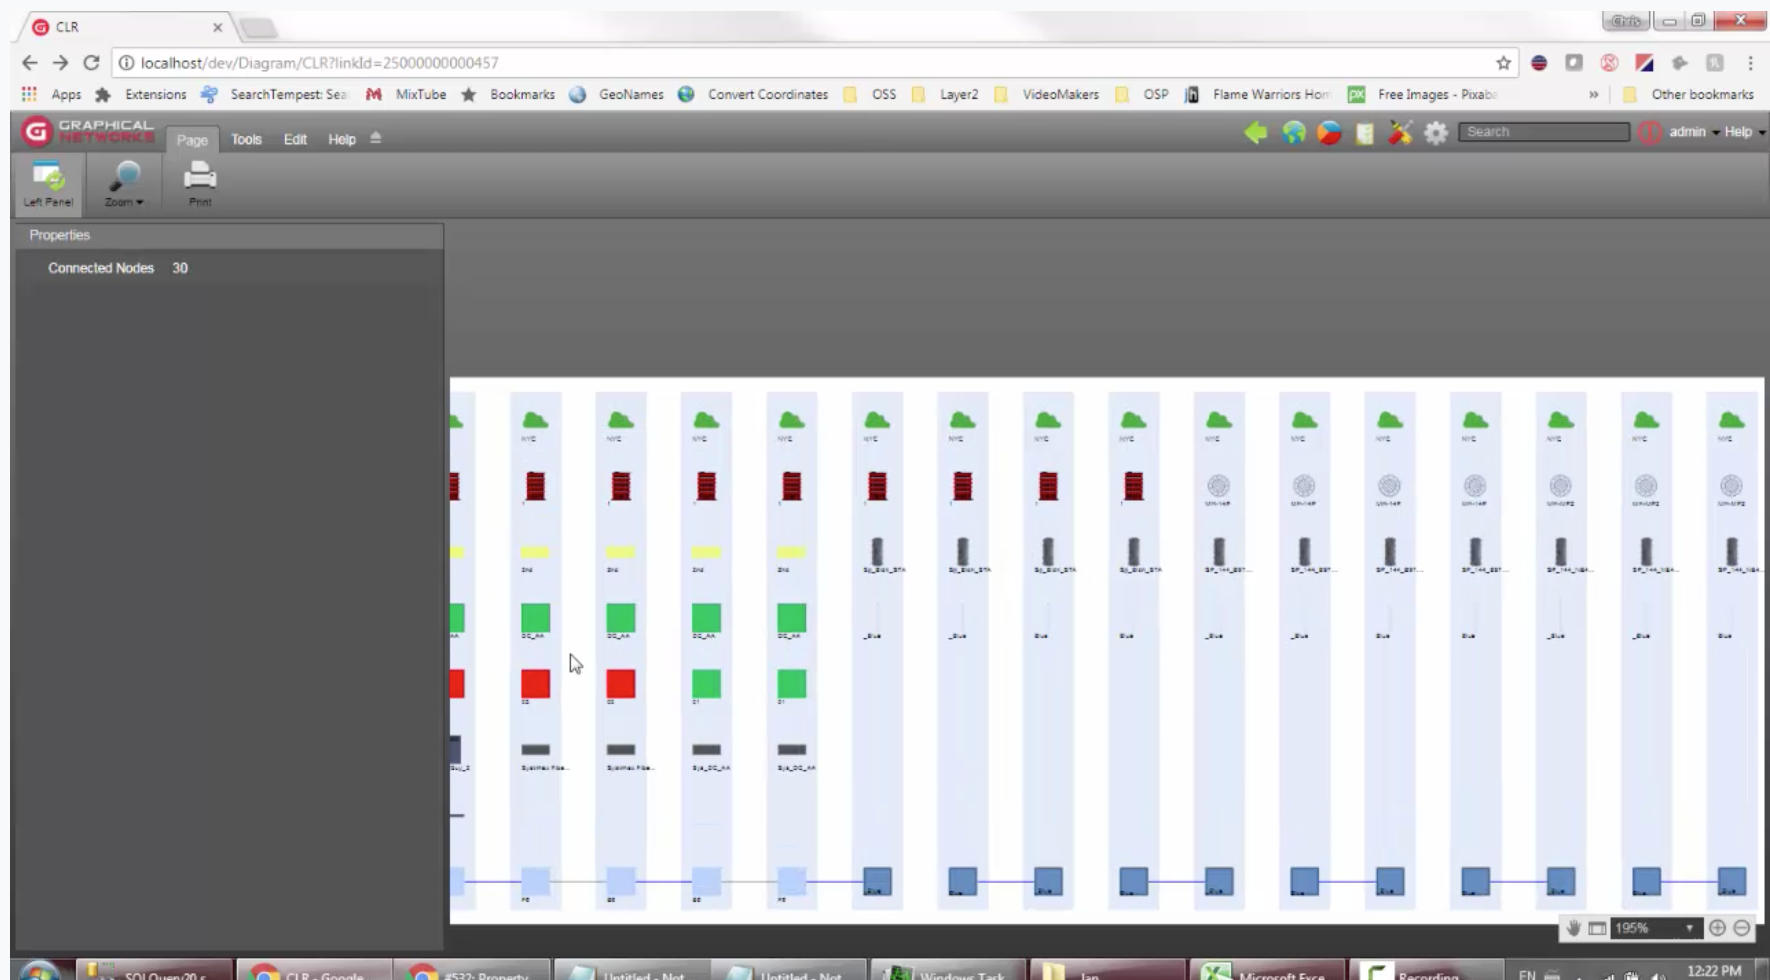
Why is that? The inside plant typically includes the rack, the room, the floor, etc. You can visually see that the hierarchy is different; with the outside plant, you’re at the map level which includes components such as splice box, splitters, and the like. It’s very easy to identify which is which because the icons in the inside plant are different from the outside plant icons.
Next, let’s return to our starting point.
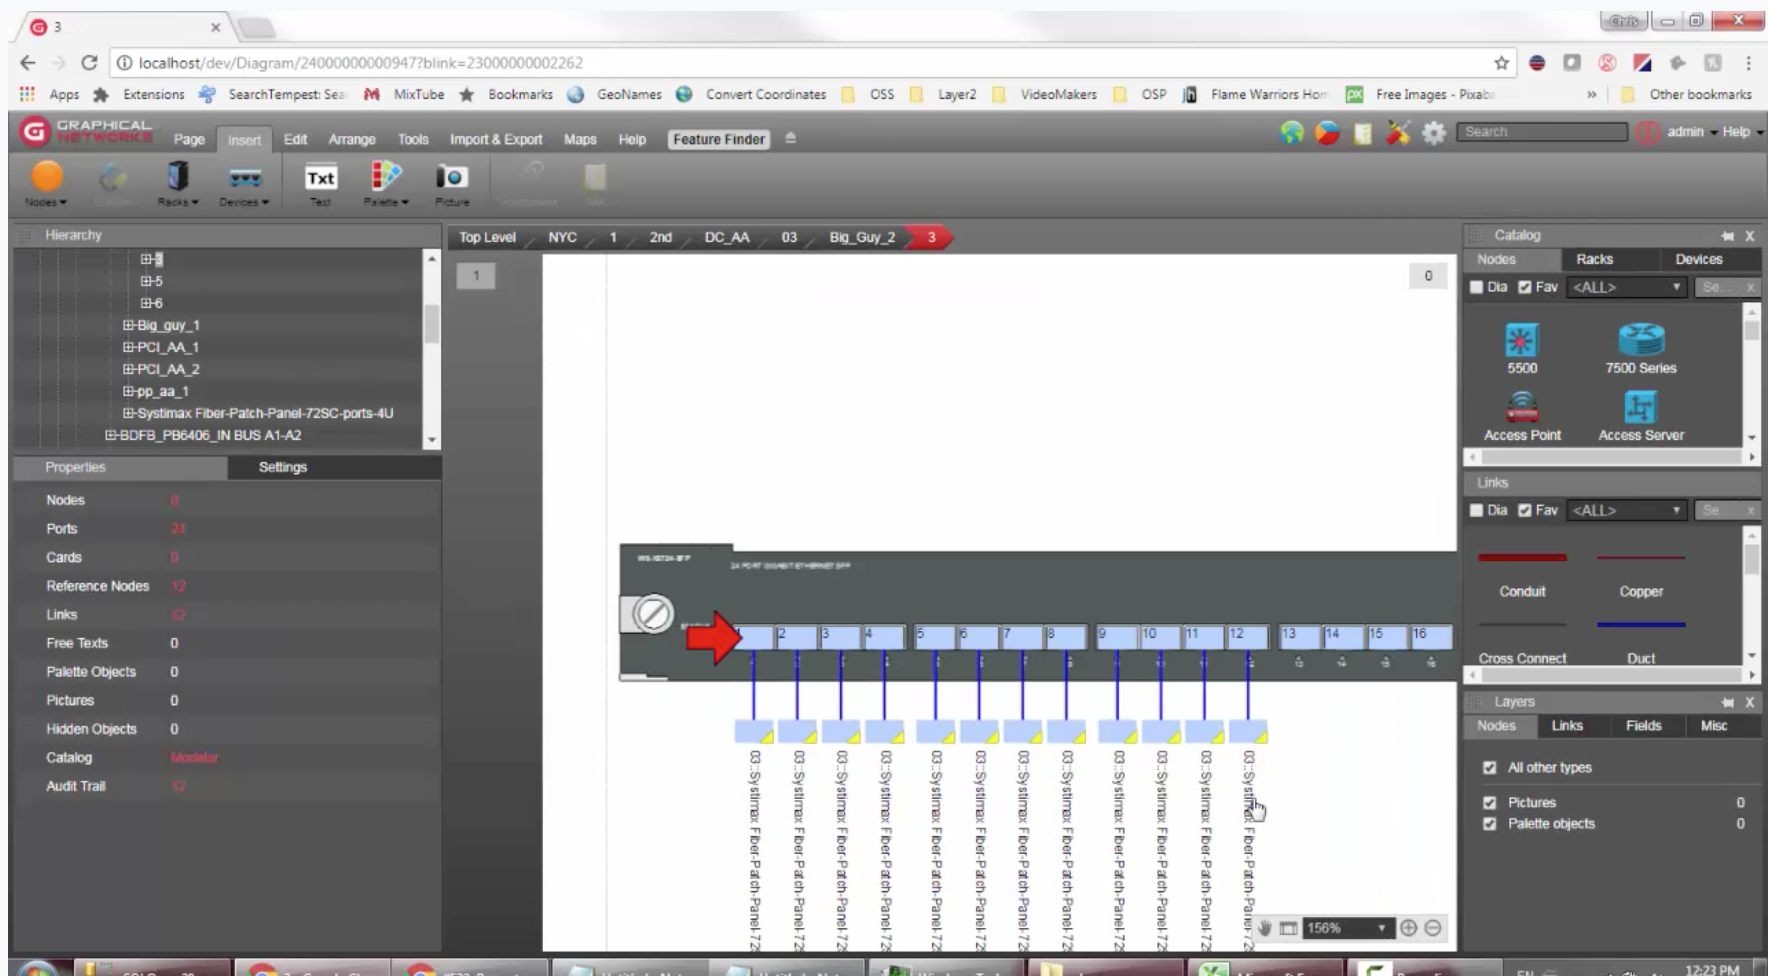
Within the router, you can see that we have 12 cables here (not just one). If you were to give this to a technician, it’s possible that they may want to see all 12 CLRs. If you were to try to depict all of them in just one diagram, this creates a big real estate problem…
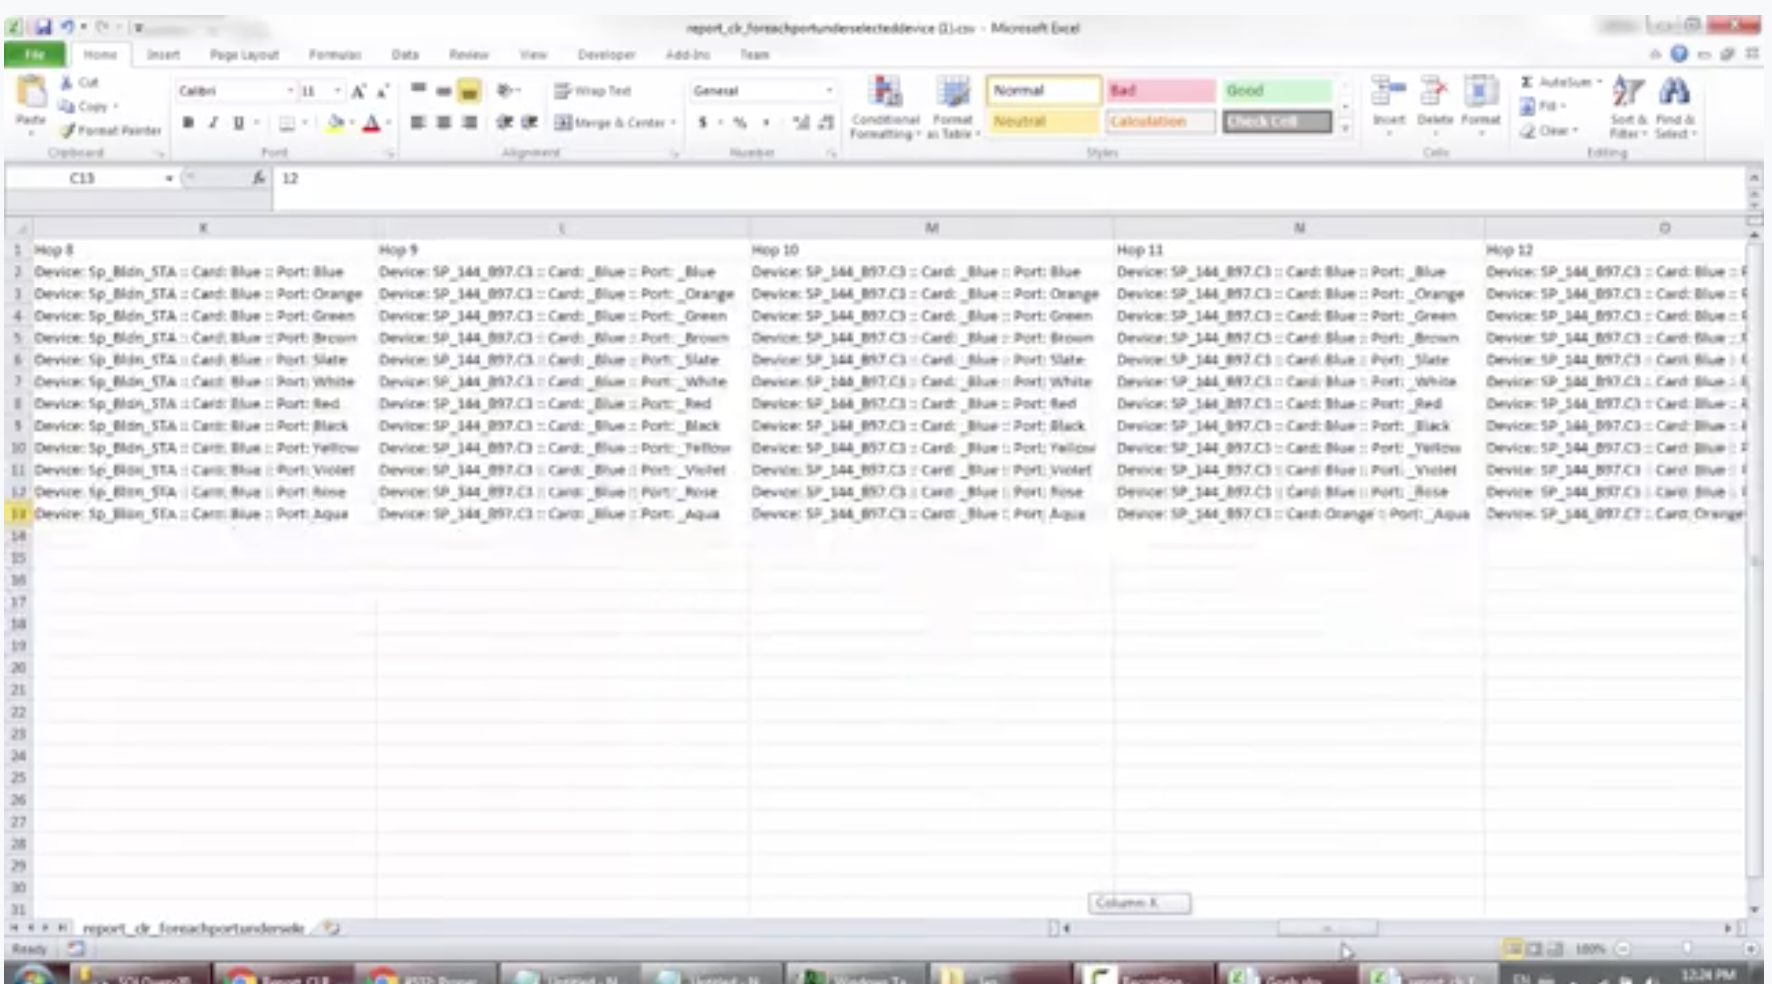
There is an alternative: create a tableview of that CLR for the multiple circuits. You can do this very easily: just right-click on the diagram (in this example, the diagram of the card that has the 12 circuits) and this will spit out the tableview for each of the 12 circuits. In this example, we have, from top to bottom — each circuit and, from left to right — each hop.
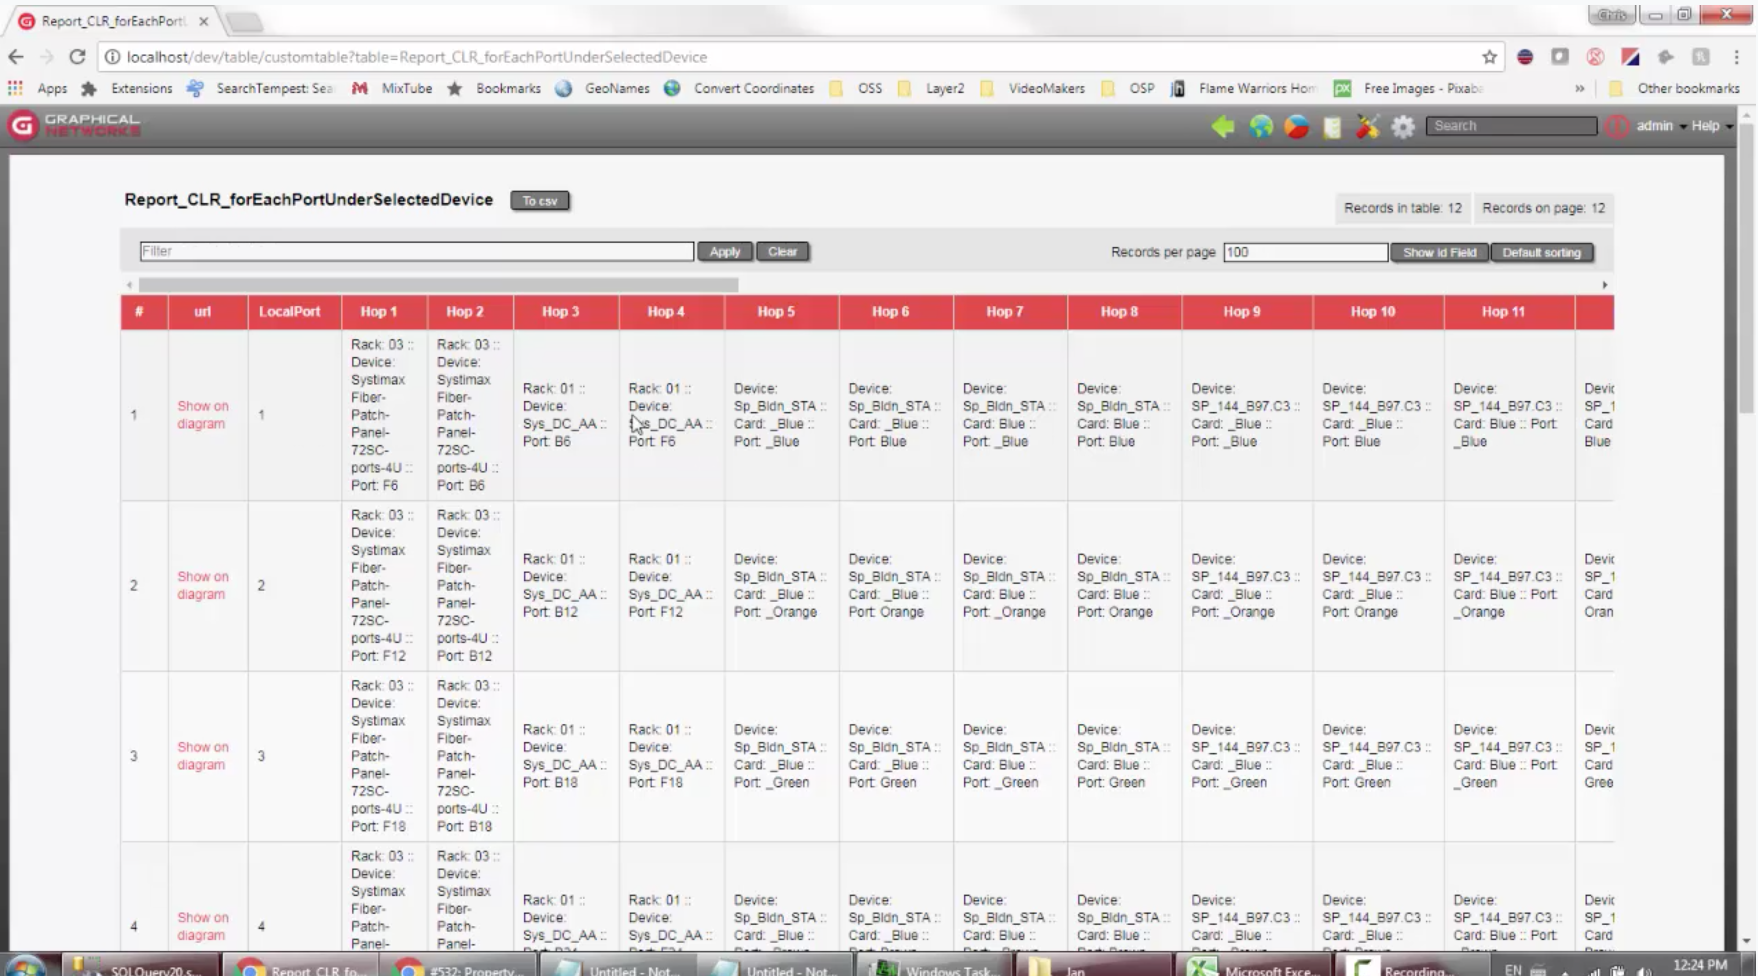
The hierarchy itself is produced and presented as text for each hop: while this is not that easy to understand as a diagram,you get the advantage of having all 12 circuits in one place.
You can export this to CSV and open it in Excel. Initially the format will be very raw but you can take the information and process it in any way you’d like. Below for example, you can see each hop here for 12 circuits with the entire hierarchy.
Tracing Circuits with Dynamic Outside Plant Maps: Conclusion
In sum, you should now have an understanding of how you can create, manage, and visualize circuits (and their entire components).
Now that you understand how circuits in netTerrain traverse from A to Z, you can now quickly find what you need for an outage, a decommissioning (so you know which parts you need to uninstall) or in any troubleshooting initiative — information that would simply be too hard and too time-consuming if you have to start looking for all of the disparate information in your different silos.