
In this, the second blog of the ROI series, we’ll do a return on investment (ROI) analysis for network documentation and network mapping software. If your main pain point is a lack of IT and network visibility and you need a better way to document and map your network and you were looking at netTerrain Logical as a potential solution then this blog and the next one where we go over a numerical example are for you.
Network mapping/network documentation software like netTerrain can help you increase the visibility and utilization of your IT assets as well as improve the network uptime by reducing the number of outages you suffer and the mean time to repair (MTTR).
There can be other savings — such as a reduction in fees and penalties because of decreased downtimes or improved revenue due to better service levels — but we won’t dive into these in this series as they can be harder to estimate.
Problem: Bad IT visibility
The 1st big cost generator around your IT infrastructure is, simply put, bad IT visibility.
Bad IT visibility comes in many forms but, usually, it’s related to stranded or under utilized IT assets such as routers, switches, servers, power equipment, and more. With the advent of hybrid networks this has only gotten worse: organizations are now relying more and more on virtual instances such as VMware, Amazon Cloud instances using AWS, and much more. Because of this, organizations around the world are feeling the costs of setting up virtual assets and Cloud instances — which somehow end up lingering in the background doing little to nothing.
While there are tools to monitor usage, a network mapping tool that really brings it all together is necessary to give enough context so you can take adequate corrective actions and jump on opportunities for optimization. Unused network ports and cables are also part of that equation, as well as unneeded licenses, applications and more.
All these leads to the obvious: the lack of proper network inventory leads to bad IT visibility which, in turn, leads to IT waste.
Obviously zombie IT assets increase network operation costs….but how much? Several studies — from consulting groups such as Meta or Gartner — have estimated that the average small-to-medium organization (that doesn’t have proper network documentation) has zombie assets that are occupying anywhere between 10% and 40% of the installed IT asset base. Because it may be somewhat complicated to, as is done in the studies, calculate exactly which percent of your assets could be affected, a good initial approach is to do a conservative estimate.
You can take a DIY approach to calculate your approximate percentage of stranded assets:
- First, define the thresholds at which an asset should be considered inefficient or define an underutilization factor
- Next, estimate an average cost for classes of assets and using the corresponding weighted under utilization factors calculate the space, cooling, power and opportunity costs associated with each of these assets
Again, this can be daunting, fuzzy, and plagued by bias — in which case a safer approach is to use a conservative number for your underutilization factor compared to the total cost of the installed IT base.
How network mapping software reduces IT utilization costs
A properly implemented network mapping and documentation tool can yield a conservative 10%+ gain in efficiency. With a tool like netTerrain Logical, inefficiencies will surface automatically after the data is populated or fed into the system. A few examples of how netTerrain does it:
- Exception reports to highlight problem areas
- Optimized cable and port reallocation by running end-to-end circuit layout records during and after a circuit decommissioning
- Asset planning and change management using netTerrain’s work order tools
With some of these measures and features implemented, you can easily see that 10%+ improvement in IT efficiency.
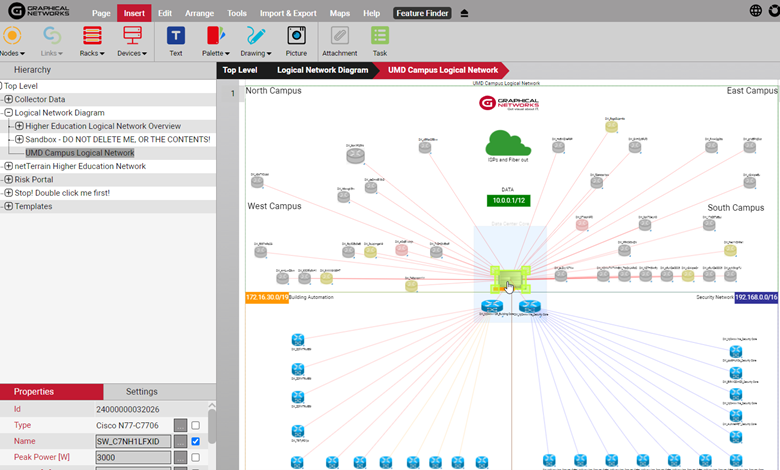 Logical to physical mapping
Problem: Downtime
The 2nd big cost is downtime. Downtime costs you money due to lost revenue, SLA penalties, decreased productivity, bad reputation, and more. There are several different studies about the cost of downtime: a fairly well-known study by Gartner estimated that each hour of downtime costs the average organization in the United States over $40,000. That’s right, no extra zero there —and that study is a few years old now. In fact, that number may be wishful thinking if your business is in markets such as banking or entertainment.
You can also do a DIY estimate for the cost of your downtime:
- compute the lost revenue based on the yearly business hours
- multiply that by the number of hours and the percentage of the impact that downtime has
Gartner estimated that the average company suffers 87 hours per year of downtime. Both factors amount to over 3 million dollars in lost revenue due to downtime alone.
In sum, deficient IT mapping, with no proper visual documentation, leads to increased downtime with the obvious impact being on the bottom line.

How network mapping software reduces downtime
As of 2021, an estimated 300 organizations have installed our IT documentation software netTerrain. This has provided us with use cases and feedback that paints a conservative figure of 10% improvement operations related to downtime, namely: lower MTTR and a decreased number of outages.
A number of features in netTerrain Logical provide insights into the network that help improve those operations, including and not limited to:
- Easy visualization cues and filters to identify single points of failure
- End-to-end circuit layout records to identify the full path of a service or circuit for faster
- Troubleshooting and less reliance on re-inventing the wheel by manually drawing the circuit
- Dependency mapping between entities affected by an outage to mitigate the impact
- Physical to logical network mapping
- Quick contact information and key detail lookup
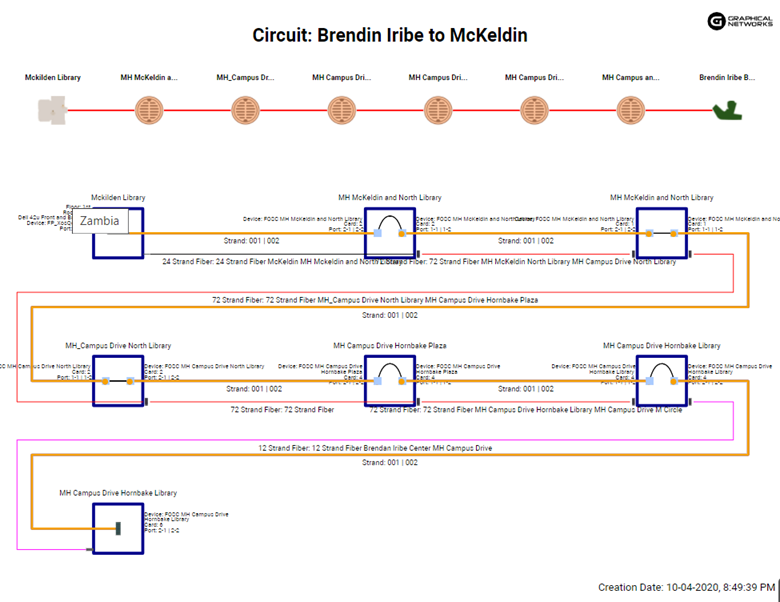 Full Circuit Layout Record
Now that we’ve identified key areas of savings that can yield a relatively quick return on investment for a network documentation tool, in the next blog, part 3, of this ROI series we will analyze a use case by inputting basic parameters in an ROI calculator utilizing a conservative approach.