Sick of troubleshooting headaches and trying to fix issues when you just don’t have the information you need? Computer network diagrams can be a big help: they keep mission critical business operations up and running. When something goes wrong in the network, computer network diagrams are the key to solving the problem and minimizing downtime.
Computer network diagrams are also crucial for ensuring network operations are efficient: diagrams show the people who work on networks what the network has and/or needs, from equipment to power. With these insights, managers can keep things efficient, cost-effective, and “green”. In essence, network documentation saves you from time by finding information quickly to fix your network problems.
What is a computer network diagram?
It’s a visual diagram that shows the various nodes in a network. Computer network diagrams can be physical diagrams or logical diagrams.
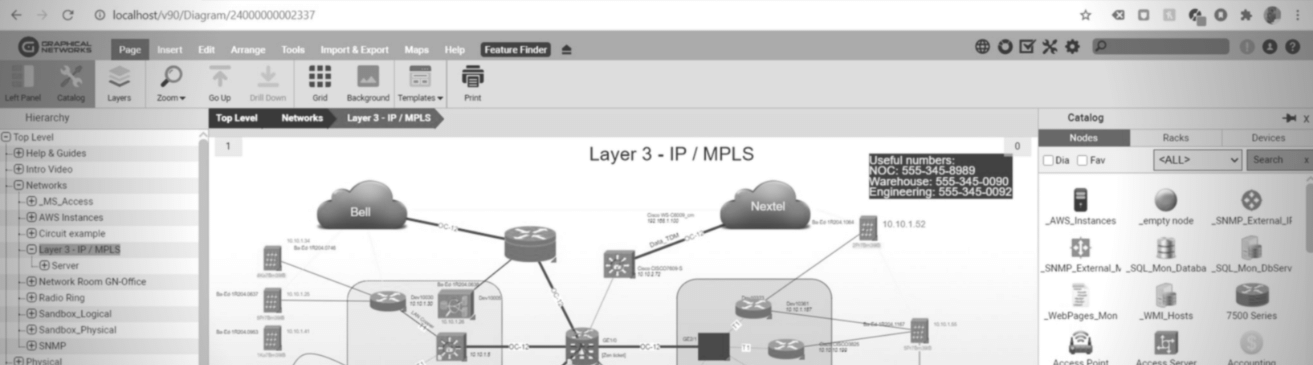
What are nodes in network diagrams? A node is anything that has the capability to, in some way, connect to another node in a network….so, a node can be a server, a router, and so on. Nodes are represented in network diagrams with icons. Different organizations use different node icons: it depends on many different factors. Below, you can see an example of nodes in a network diagram rendered by our network diagram software netTerrain:
 In a computer network diagram, a node can be anything
Diagram software like netTerrain lets you choose whatever nodes you’d like; you can use green blobs, use item-specific images that accurately depict what the actual node looks like, and so on. You may see that some computer network diagrams have clouds as icons: generally speaking, clouds in a network diagram are used to show networks that are adjacent to, but separate, from the network that’s in the diagram.
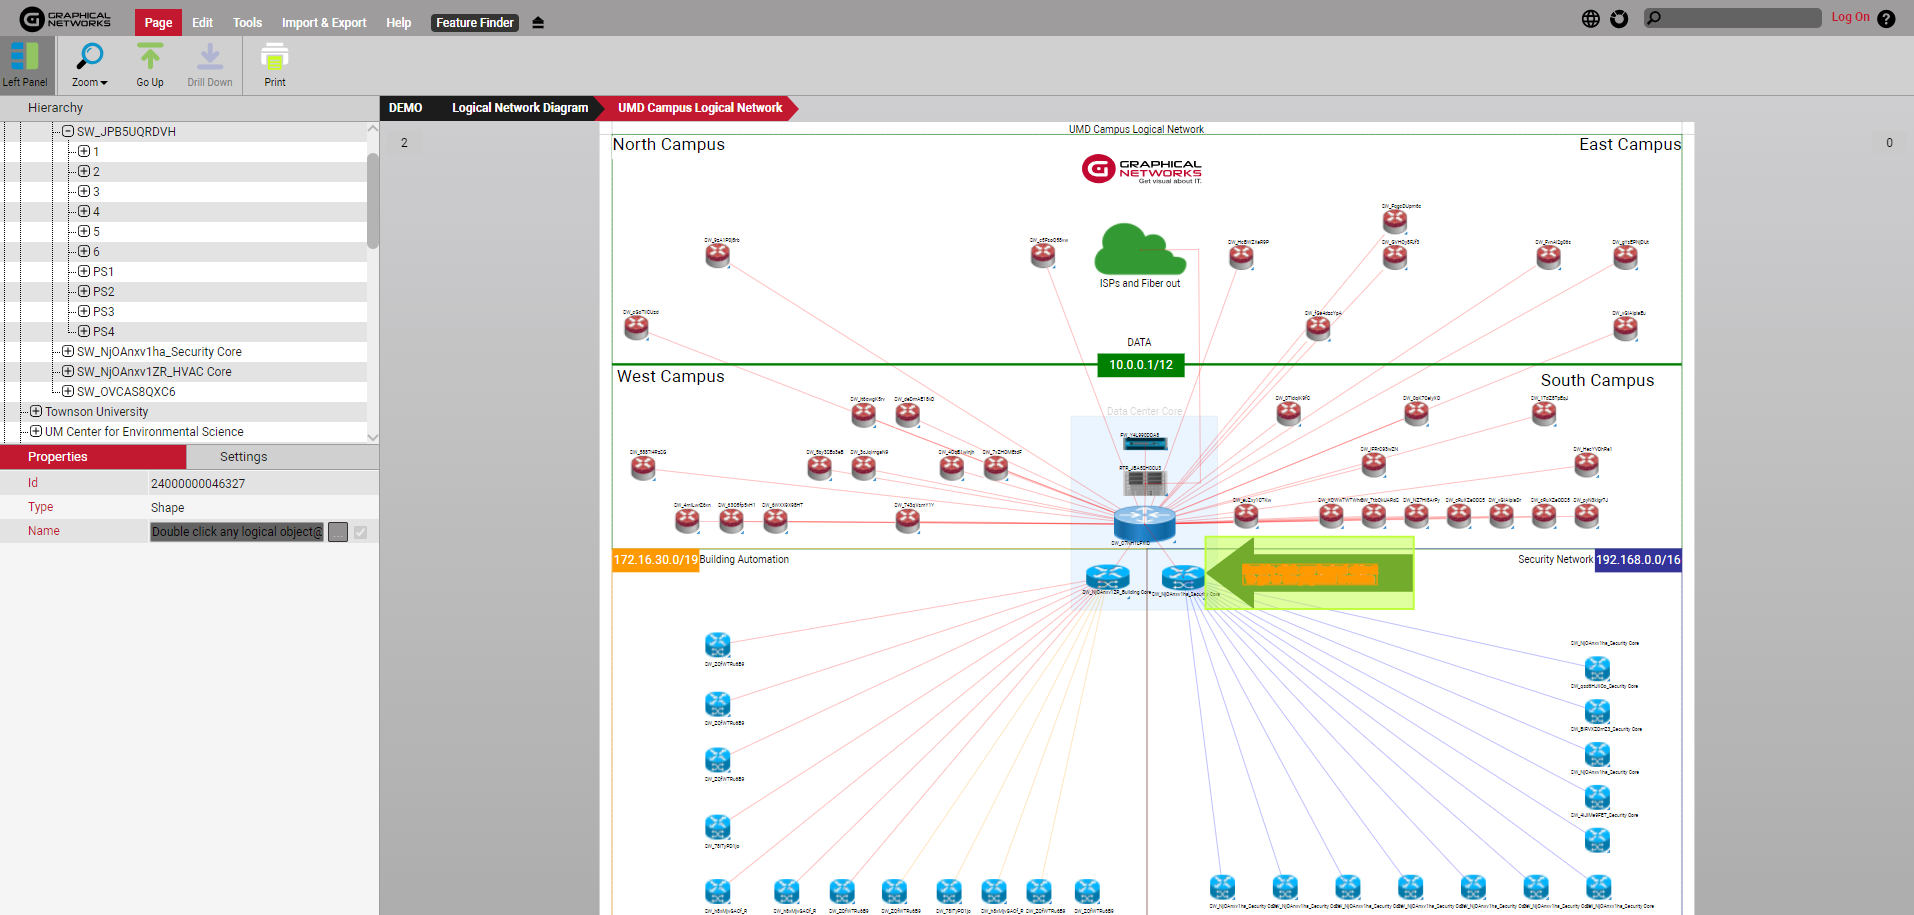
What’s a link in a network diagram? It’s the way through which nodes in a network are connected. Diagram software like netTerrain lets you put in a variety of different links: you can customize the way links are depicted by color, line style, thickness, whether it blinks or not, and more. Click here to read more about links in network diagrams.
 In computer network diagrams, links show connections between devices
What does a computer network diagram depict?
Computer network diagrams come in many different flavors. What you see depicted in a network diagram will really depend on what you’ll be using the diagram for. For example, some diagrams may show L2 connectivity whereas others won’t. Network diagrams can show physical and logical topologies, depending on what you need to see. With network diagram software, you can start with a very high-level view of the network, for example: locations on a map, and then drill down to get as detailed and specific as needed, and, for example, see the ports on a diagram.
In general, computer network diagrams may show any of the following:
- Application Views
- Network storage
- Backups
- VoIP
- Links/Connections/Cabling
- Logical views
- Physical views
- Cloud Infrastructure Views
The above isn’t a complete list, by any means, but it gives you a basic idea.
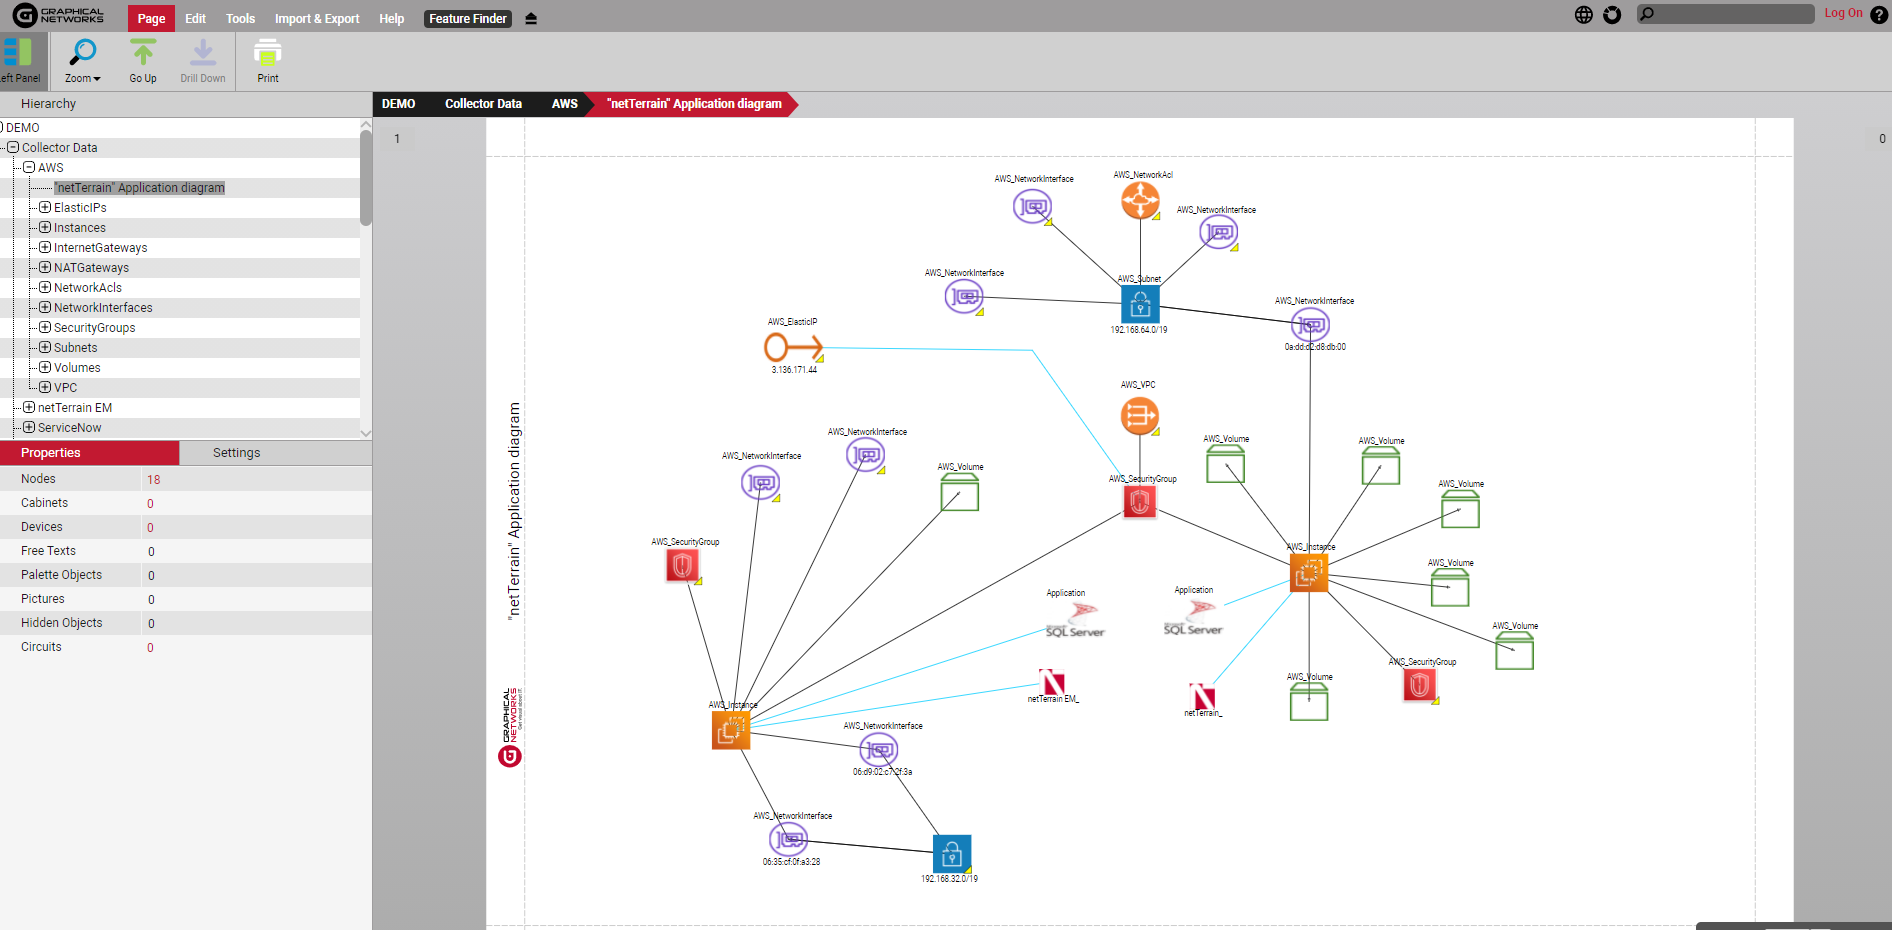 Example of an application view in a computer network diagram
For links/connections/cabling, these diagrams are important to see how your cables are built out in your network, for example: what kind of cables are in the network…fiber, copper, Ethernet? Where, for example, do they enter and leave?
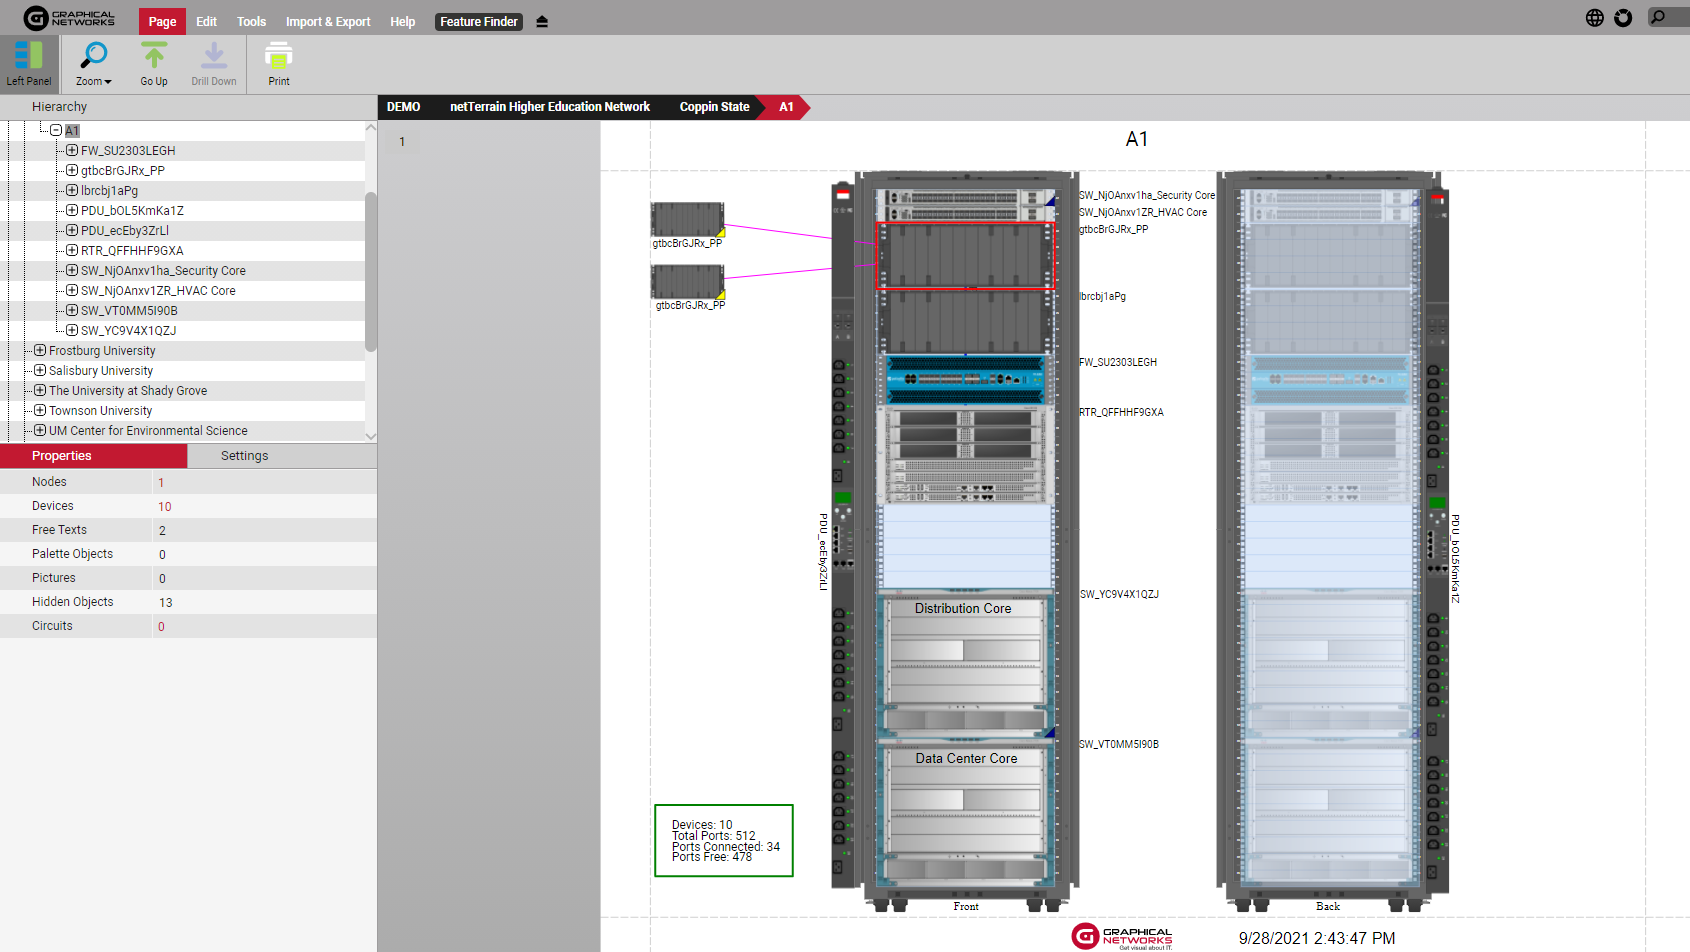
To help with managing rack and room capacity, whether it be a data center or telecom room, network diagrams may also include documenting the physical infrastructure how your network racks are laid out, with details such as equipment names, equipment types, its connections and port availability on a per device, rack, or even by rows.
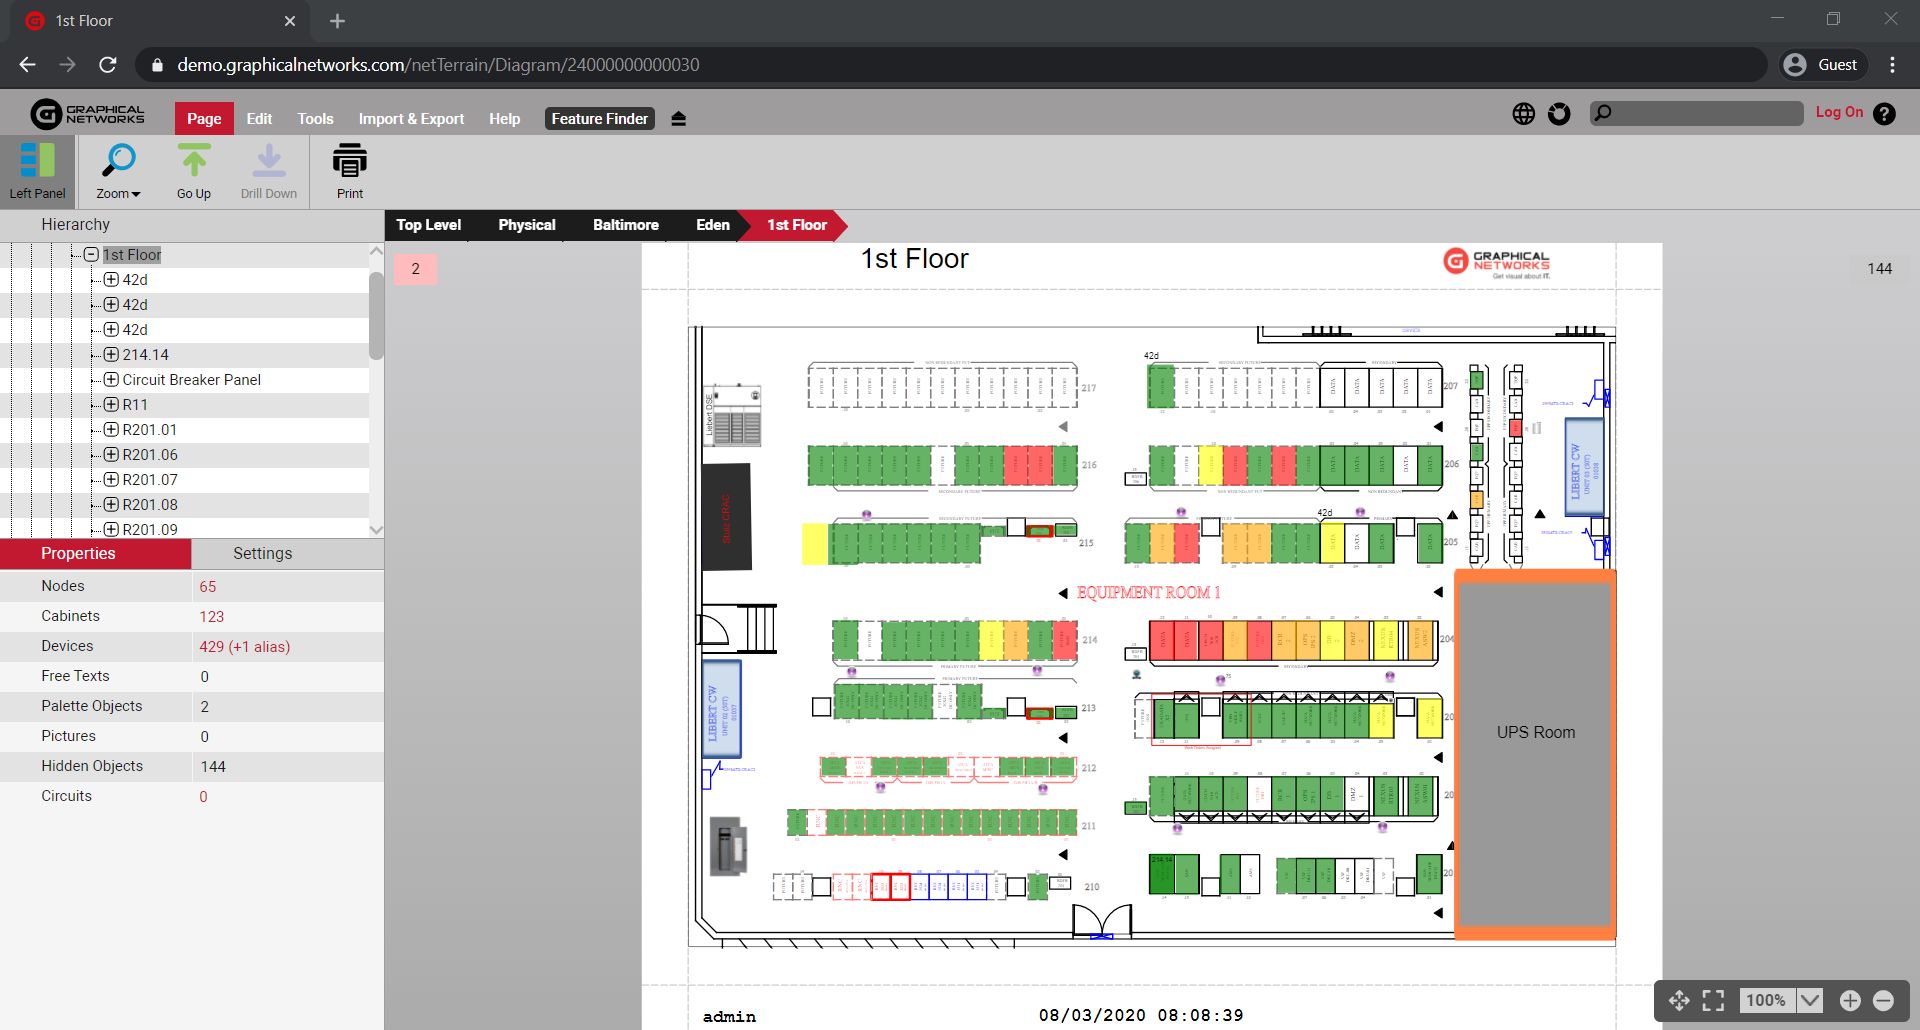 Example of a Data Center floor plan in a computer network diagram
Another item to highlight are the Cloud infrastructure views in network diagrams. A network Cloud architecture diagram will help you understand how your cloud services are connected and how traffic flows in and out.
How do you create computer network diagrams?
You can create network diagrams by hand, you can create them using software like Visio, or you can use documentation software like netTerrain that blends the best of hand drawing tools with automation: netTerrain goes out and discovers the network with clicks…and you start documenting your network in seconds! If you’d like to test drive netTerrain, click here to get started.