Rack and Cabinet Diagrams – why are they needed? What exactly is a rack diagram? In the IT and network world, rack diagrams are a visual representation of IT hardware equipment inside a network/server rack.
They’re used to track and manage: what assets are in each rack and where in the rack are they located.
What’s the difference between a rack and a cabinet?
We talk use these words, rack and cabinet, interchangeably in our software netTerrain, but: there is a difference (a cabinet is completely enclosed, whereas a server rack is open and has no sidewalls; cabinets provide a higher level of security for your hardware and helps prevent hot air from mixing from cabinet to cabinet).
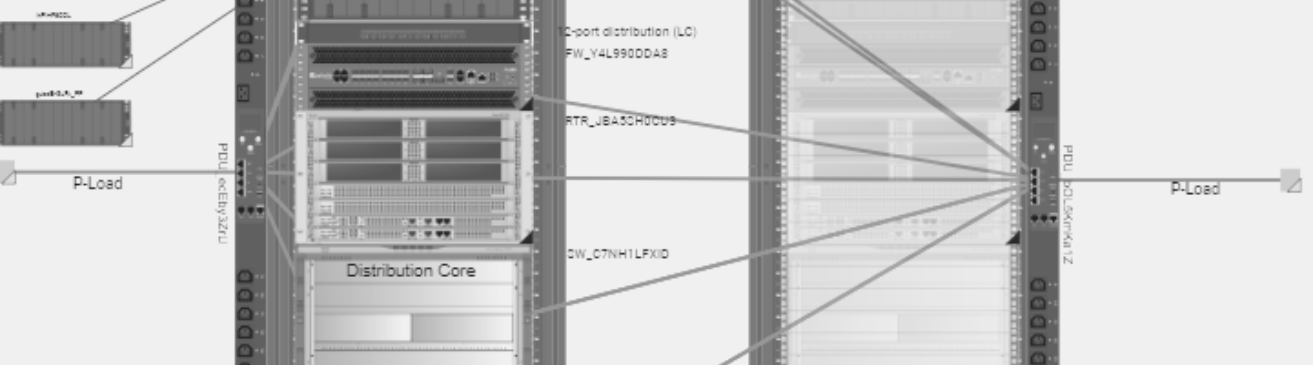
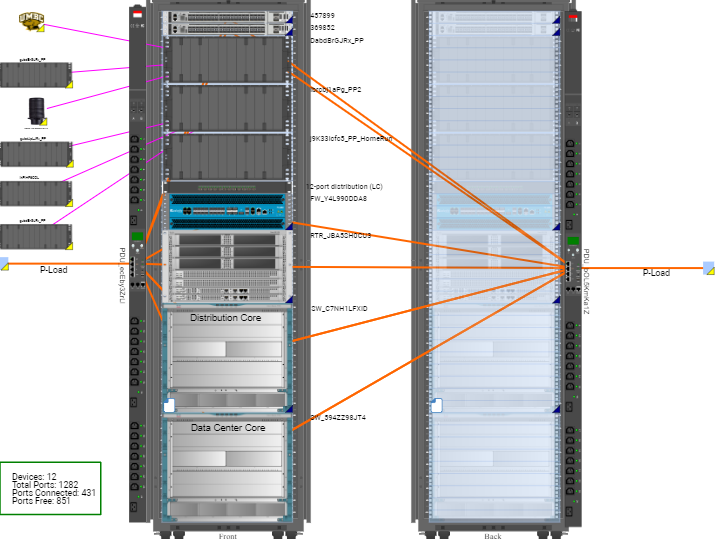 Example: rack diagram in netTerrain
What are the benefits?
So, ok….creating these nice rack diagrams that show the equipment, what are the benefits for having rack diagrams? Are rack diagrams just rack diagrams? There are quite a few benefits off the top of my head.
These include:
- Asset management inside the data center
- Efficient capacity planning
- Hardware costs & spending reduction
- Cable management (especially for moves)
Managing assets
After placing all your equipment inside your racks, it is easy to manage your assets. With netTerrain for example, since it is a client-server application, you can easily run asset and inventory reports for each room and rack to list all devices and view the reports in a dashboard style report, table query reports, and diagram view reports.
Want to see the exact equipment model and rack/cabinet manufacturer in your diagrams? netTerrain’s catalog has the exact manufacturer device model drawn and includes the back of the device with its associated slots, cards, ports. Same goes for the vendor specific rack/cabinet too. Don’t see it in the catalog? Just ask our support team and we will have this out to you in 24 hours! No need to wait for the next software version release!
IT Asset management (ITAM)
This is just more than managing your physical assets – IT Asset Management also helps with the lifecycle of the equipment, such as tracking warranties, maintenance and services contracts, and other information such as cost. Do you need that new shiny, very expensive, router, or can you utilize your existing ones? With netTerrain, you can add as many data field attributes, such as these items and run reports on them to accurately forecast spending and when the time comes to retire an asset, you can utilize the netTerrain’s built in work order tasks to properly follow your change management processes to decommission an equipment.
Capacity planning
Need to find space for a 4U equipment inside your data center with the contiguous space, and power and weight availability? That’s what rack diagrams are here to help you. With netTerrain’s device catalog, these come with the name plate, space, power, and weight for each equipment. Meaning, that you can toggle between these three capacity items (space, power, and weight) from a rack diagram view, data center capacity dashboard reports.
Cable Management
Don’t forget about the cables attached to your equipment! Traditional rack diagrams don’t show this and this is when spreadsheets come into play. But can you have both and show the connections in rack diagrams? In netTerrain, you can!
For cable management, especially when moving equipment, it will help you know which cables go to which port and put the cable back in place and help reduce errors! We talk a lot about zombie cables and how this impacts capacity planning – the ability to know how many ports are free and those that are used.
To sum up: rack diagrams help your organization save money by reducing errors and unnecessary equipment purchases, improve capacity planning and management (space, power, weight), and help you untangle your cabling infrastructure.