Data Center Rack Density: Five Practices for Accurate Measurement and Capacity Planning

- Chapter 1: DCIM Software
- Chapter 2: Data Center Power Distribution
- Chapter 3: Green Data Center
- Chapter 4: Data Center Cooling Methods
- Chapter 5: Data Center Environmental Monitoring
- Chapter 6: Data Center Cable Management
- Chapter 7: Data Center Layout
- Chapter 8: Data Center Rack Layout
- Chapter 9: Data Center Rack Density
Data center rack density is the total IT load per rack measured in kilowatts. This figure sets the baseline for whether your cooling, power distribution, and capacity planning will hold up or fall short under real workloads. According to the AFCOM State of the Data Center Report, average density reached 27 kW per rack in 2026, up from 7 kW in 2021, and 69% of operators expect it to continue rising.
The five practices below are meant to be followed in order: measure accurately, reclaim unused capacity, match hardware and cooling to your actual load, separate airflow, and bring everything together in a platform that enables proactive decisions.
Summary of best practices related to data center rack density
| Best practice | Description |
|---|---|
| Measure data center rack density against real load, not nameplate ratings | Calculate kW/rack from metered PDU readings, not nameplate values, which routinely overstate actual draw and misalign cooling and power infrastructure. |
| Identify and reclaim stranded capacity before adding new resources | Audit reserved but unused power, space, and ghost servers before provisioning new capacity; without active monitoring, stranded power can account for a significant share of installed capacity. |
| Select the right hardware and cooling strategy based on your actual density tier | Match cooling to your measured kW/rack: perimeter air cooling under 10 kW, in-row or rear-door solutions for 10-20 kW, and liquid cooling above 20 kW. |
| Optimize physical rack layout, and contain your aisles | Arrange racks in hot- and cold-aisle pairs, place high-density cabinets closest to the CRAH supply, and use containment with blanking panels to prevent air mixing. |
| Use DCIM to manage rack density, redundancy, and capacity growth in one view | Connect power consumption, rack inventory, and capacity state in one platform, so density decisions are based on current data. |

netTerrain. Battle-tested & affordable DCIM Software
-

Manage data center floor plan, rackspace, cabling, power distribution, and more
-

Use analytics to optimize data center capacity and energy costs
-

Deploy quickly using asset discovery tools and pre-built integrations
Measure data center rack density against real load, not nameplate ratings
Why nameplate figures produce the wrong baseline
The formula is simple: for a single rack, “power density” is the total power draw of all equipment installed in it. When averaging across a row or facility, divide the total IT load by the number of populated racks.
The problem lies in the inputs. Nameplate ratings reflect the manufacturer’s worst-case figures under peak conditions, not actual production usage. Relying on nameplate-based calculations consistently leads to overprovisioned power capacity, directly inflating both capital and operational expenditures without delivering proportional IT capacity.
Sizing cooling and power based on nameplate values leads to two outcomes: either over-provisioning and tying up capital, or under-provisioning and risking a lack of headroom during workload spikes. Metered data lets you avoid both.
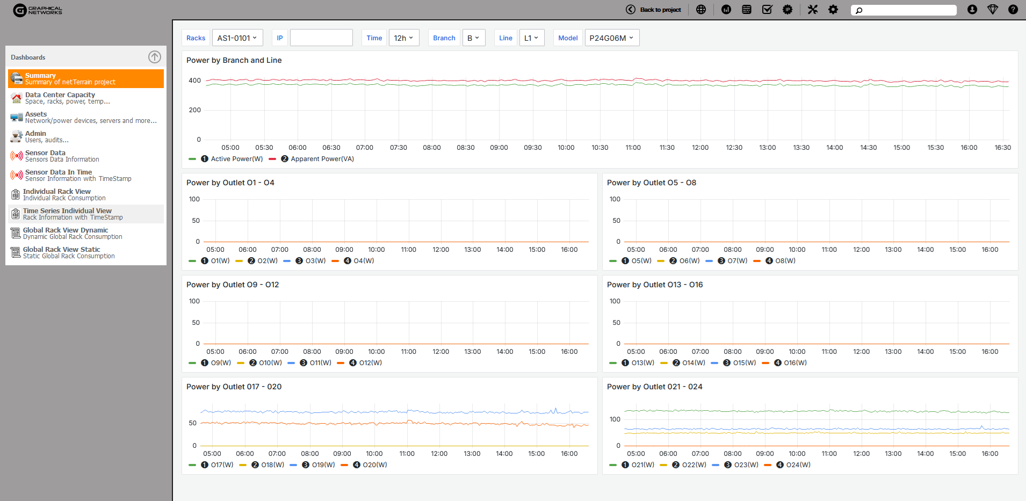
Take a 20-rack row that has a nameplate total of 300 kW, but only 130 kW shows up on the metered PDU output. That 170 kW gap is unused cooling and power capacity you could use for more hardware. Always use metered PDU output as your baseline, not device catalogs or spec sheets.
Data center rack density tiers and what they mean for infrastructure decisions
Once you have an accurate kW/rack figure, the next step is knowing which tier it falls into, since each one implies a different cooling method. The following thresholds mark where engineering constraints change, not just the load’s size. Moving up a tier typically means you need a different cooling method, not just more capacity.
This article uses four density tiers throughout:
- Standard: under 10 kW
- High density: 10 to 20 kW
- Ultra-high density: 20 to 40 kW
- Extreme density: 40 kW and above
How kW/rack, power usage effectiveness (PUE), and W/ft² serve different decisions
Each of these metrics serves a different purpose. kW per rack indicates the load concentrated in the rack and guides cooling and PDU choices for specific rows. PUE is a facility-wide efficiency metric that compares total input power to IT load. W/ft² is mainly for space and real estate planning. Even a facility with a good PUE can have hot spots in its densest rows, so use each metric for its specific decision point.
| Common mistake: Sizing cooling and power infrastructure against nameplate ratings. Consequence: Cooling and power systems end up misaligned with actual load, either locking up capital in overcapacity or leaving no margin when workloads spike. |
Identify and reclaim stranded capacity before adding new resources
What stranded capacity looks like in practice
Stranded capacity is power, space, cooling, or networking capacity that is installed but not delivering useful work. It will not show up in alarms or on standard dashboards; instead, you will see it when racks are provisioned for more than they draw, decommissioned servers are still counted, or canceled projects leave cabinets allocated. If you do not track it, you risk buying new capacity you do not need.
In its annual power and capacity research, the Uptime Institute has documented that data centers can lose 10% or more of their UPS capacity to stranded power: electrical networks that have been built and are energized but are not actually consumed by IT equipment or its supporting systems. In larger, more complex facilities, the proportion tends to rise because the gap between provisioned and consumed resources widens as organizational complexity and the pace of infrastructure change increase.
The four forms of stranded capacity and how to find each one
| Type | Symptom | How to find it |
| Power | The allocated budget far exceeds the metered draw | Compare PDU metered output to power budget per rack |
| Space | Empty U positions in cabinets logged as occupied | Rack utilization report by cabinet |
| Cooling | Low thermal load alongside disproportionately high cooling energy cost | Delta T analysis per row |
| Ghost servers | Zero network traffic with active power draw | Auto-discovery cross-referenced with network activity logs |
| Networking | Switch ports allocated to unpopulated racks | Cross-reference port allocation against active rack inventory |
Auditing existing allocation before ordering new capacity
Ordering new infrastructure before you audit what you already have is a common and costly mistake. Always audit your allocations first, then order PDUs, cooling, and power feeds, since these often have long lead times. Discovering after the fact that you had enough capacity is an avoidable setback. Reclaiming just 20% of stranded power in a mid-sized facility can delay capital spending by a year or more.
You can only find stranded capacity with the right tools. Without live monitoring and auto-discovery, you are stuck with manual audits that often miss underutilized resources. With a DCIM platform that performs continuous discovery, like NetTerrain DCIM, you get real-time alerts when a rack’s metered draw drops well below its provisioned capacity or when devices remain inactive for too long. The platform can flag racks drawing less than half their allocated power, so you can reallocate capacity instead of buying more hardware. This operational view gives you actionable data for timely decisions and keeps you from relying on outdated estimates.
| Common mistake: Ordering new infrastructure before auditing existing allocation. Consequence: You end up paying for capacity that was already there, often after long PDU and cooling lead times have already run. |
Select the right hardware and cooling strategy based on your actual density tier
Why the cooling decision has to precede the deployment decision
Most retrofit cooling projects happen when a new workload pushes you past your existing capacity, forcing you to buy in-row units at full price and under time pressure, often with unplanned maintenance. The better approach is to set your rack density ceiling before you deploy new hardware, not after you get thermal alarms.
Consider what happens when a facility running perimeter computer room air conditioner (CRAC) units sized for 8 kW per rack installs a GPU cluster that pushes the load to 35 kW per rack. The ASHRAE TC 9.9 Thermal Guidelines for Data Processing Environments define a recommended inlet temperature range of 18 to 27 degrees Celsius for A1-class equipment, with an allowable upper limit of 32 degrees Celsius. Standard perimeter air cooling cannot maintain those ranges at 35 kW per rack. Inlet temperatures breach those limits within weeks, and emergency in-row cooling ends up costing three times the planned budget. A decision framework referenced before procurement would have changed the outcome entirely.
Hardware and cooling selection by data center rack density tier
The table below matches density ranges to hardware profiles and cooling methods for each tier. Treat these as engineering cutoffs, not suggestions, to avoid unnecessary retrofits.
| Density Tier | Typical Workload & Hardware | Cooling approach | Key considerations |
| Standard (under 10 kW) | General servers, virtualization; air-cooled equipment (ASHRAE A1-A2 class) | Perimeter CRAC/CRAH | Hot/cold aisle layout; blanking panels essential |
| High density (10-20 kW) | HPC, dense databases, entry-level GPU | In-row cooling or rear-door heat exchanger | Verify PDU circuit capacity; check row-level airflow balance |
| Ultra-high density (20-40 kW) | GPU clusters, AI training workloads, large HPC clusters | Direct-to-chip liquid cooling (primary) | Water infrastructure and leak detection required |
| Extreme density (40+ kW) | AI training racks, NVLink clusters | Immersion cooling or hybrid liquid/air | Facility-level design change; not a retrofit option |
Schneider Electric has confirmed, in collaboration with Nvidia, that current-generation Blackwell-based systems require approximately 132 kW per rack at full load, with the next generation expected to reach 240 kW per rack. These are not incremental increases; they represent a category shift that invalidates most air-cooling assumptions for racks below 40 kW. At this threshold, air cooling is insufficient because the required air volume and velocity exceed what data center airflow systems can reliably deliver, as detailed in Compute Forecast’s 2026 review of data center rack density standards.
CFD simulation is a standard part of data center thermal design, regardless of rack density. Modeling before deployment helps you find hot spots and airflow problems that are much cheaper to fix before racks are installed. CFD tools are separate from DCIM platforms; thermal modeling apps perform the simulations, while DCIM provides the asset and power data they need. If your hardware plans include AI training, liquid cooling is required, more than just an option. The Lawrence Berkeley National Laboratory airflow management research program offers proven models for this kind of pre-deployment thermal analysis.
| Common mistake: Committing to a hardware placement decision before establishing your density ceiling. Consequence: Retrofit cooling under time pressure, typically at three to five times the cost of a planned deployment. |
Optimize physical rack layout and contain your aisles
Layout decisions made at deployment are expensive to undo
Row orientation and aisle direction are structural decisions, not just setup details. If you do not separate hot and cold aisles, you will be forced to make constant cooling adjustments. Fixing layout problems after racks are installed means downtime, physical rework, and often a temporary loss of capacity.
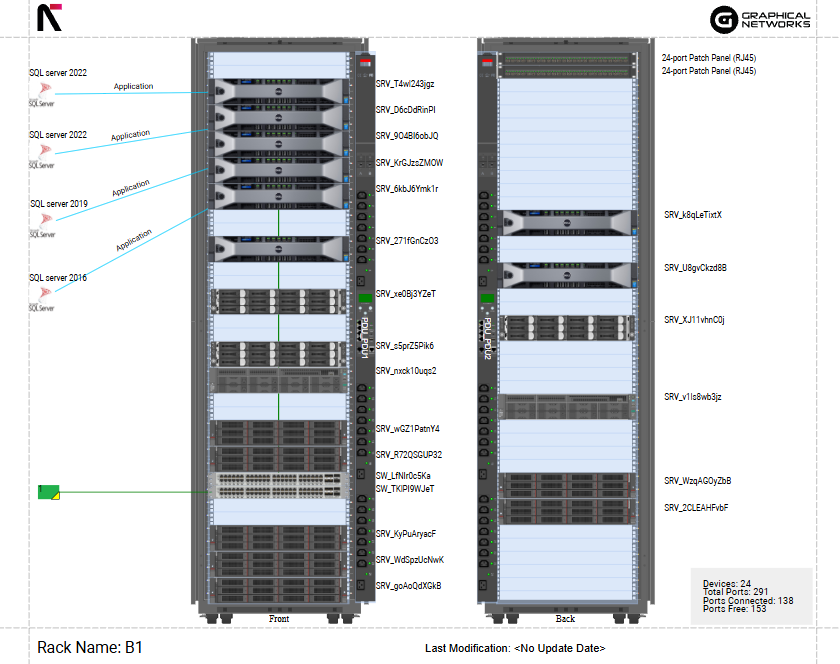
Equipment placement in a row matters. If you put high-draw cabinets at the far end of a cold aisle, where supply air is weakest, you can create hot spots even if the total cooling load is within limits. Always place your highest-draw racks closest to the CRAH supply, where cold air is strongest and most reliable.
netTerrain recognized as “Major Player” in IDC MarketScape’s 2026 Datacenter Facilities Management Software Vendor Assessment
What uncontained airflow actually costs in power and money
Hot exhaust recirculating into the cold aisle intake forces CRAC and CRAH units to register higher return temperatures than the actual rack load warrants, causing them to compensate by increasing output. Airflow management improvements, such as containment and blanking panel installation, can reduce cooling energy consumption by 20 to 30 percent in facilities where hot and cold air are mixing, according to research by the Lawrence Berkeley National Laboratory (LBNL). The rack load remains unchanged, but the cooling costs increase. Energy is spent on air mixing rather than on removing heat from equipment.
Blanking panels address a different but related issue. Every open U position acts as a pressure bypass, letting cold air escape through gaps rather than through the equipment. At high density, a missing panel in a critical row can raise inlet temperatures on nearby racks by several degrees, pushing cooling units into higher operating ranges and reducing your thermal margin. Blanking panels are inexpensive, but skipping them becomes more costly as density increases.
Cold aisle containment seals off the cold supply side with doors or curtains to keep hot exhaust out. It is easier to retrofit, does not require overhead ductwork, and works well at moderate densities. For most sites moving from no containment, this is the place to start.
Hot-aisle containment, which encloses the exhaust side and channels hot air directly into the return plenum or ductwork, is especially effective above 20 kW per rack. At these densities, hot-aisle containment outperforms cold-aisle containment because higher heat loads can force hot air through gaps in the cold aisle, reducing cooling efficiency. Containing the hot aisle reduces recirculation and keeps inlet temperatures stable. For densities below 20 kW, cold-aisle containment with blanking panels and a consistent row layout usually provides enough separation between hot and cold air.
(Source: graphicalnetworks.com)
| Common mistake: Running racks without aisle containment or blanking panels. Consequence: Cooling energy compensates for air mixing rather than removing heat from equipment, raising operational costs without improving thermal margins. |
Use DCIM to manage rack density, redundancy, and capacity growth in one view
What you are missing without platform integration
A standalone power meter may tell you that a rack is drawing 18 kW but not show which device caused the jump from 12 kW last week, whether you are near the PDU circuit limit, or if nearby rows have capacity for migration. That context is in the DCIM. Without it, rack density management becomes reactive, and you end up solving problems that were visible in the data weeks earlier. Standalone tools are always out of date by the time you need to act. As rack density rises and your margin for error shrinks, the cost of that lag increases.
What changes when rack density data lives in the platform
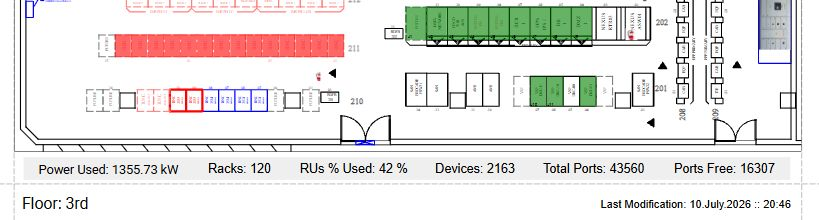
A unified view of power consumption, rack inventory, and capacity state compresses a placement decision into minutes that once required cross-referencing multiple tools and teams. Real-time kW per rack sits alongside available U space, circuit loading, and PDU utilization per cabinet. Stranded capacity appears automatically in discovery reports rather than surfacing only during manual audits. Power budget discrepancies relative to metered draw are visible simultaneously at the rack, row, and floor levels.
Redundancy status parameters like UPS load, PDU circuit availability, and cooling headroom per zone appear in the same view as rack density, not in a separate system. Capacity projections based on real consumption trends give you a realistic lead time before you hit a ceiling. This shift from reacting to anticipating turns rack density management from a recurring fire drill into a controlled planning process.
Integration protocol reference
Connecting existing infrastructure to a DCIM platform requires pairing the right protocol to each device type. The three most common integration paths are outlined below.
| Protocol | Typical use | Notes |
| SNMP | Rack PDUs, legacy sensors, UPS units | Widely supported; polling-based; most existing hardware already speaks it |
| Modbus, BACnet | CRAC/CRAH units, industrial cooling equipment | Standard for facility-side hardware; required for most cooling plant integration |
| REST API | Modern DCIM platforms, third-party integrations | Preferred for bidirectional data exchange and automation workflows |
| Connectors | Other systems perform DCIM-related measurements. Monitoring, etc | Platform-level integration for third-party monitoring tools |
| Redfish | Modern servers and BMCs | DMTF open standard for out-of-band server management; successor to IPMI |
| IPMI | Legacy servers and older BMCs | Established out-of-band management protocol |
| SSH | Script-based or CLI integrations | Useful where native protocol support is absent |
A common concern in legacy sites is whether your hardware can connect to a DCIM platform. Most rack PDUs manufactured after 2010 support SNMP, so you can usually retrieve metered power data without replacing the hardware.
For CRAC and CRAH units, Modbus is standard. If a unit is older, a serial-to-Modbus converter is usually a cheap fix before you consider replacement. Integration is often easier than it sounds, and the real challenge is deciding which thresholds and reports to use once the data is flowing.
(Source: graphicalnetworks.com)
netTerrain DCIM provides power consumption data, rack asset inventory, capacity state, and redundancy status in a single hierarchical view spanning from the individual rack to the campus level. Because it supports all three protocols above, existing PDUs, cooling units, and sensors can be connected to the platform without requiring hardware changes on the facility side.
| Common mistake: Managing rack density with point-in-time spreadsheets or siloed monitoring tools. Consequence: By the time a capacity problem is visible, the decisions that caused it have already been made. |
Infrastructure clarity for organizations across all industries
Conclusion
Rack density issues do not occur suddenly; they develop over time. Facilities built for 8 to 10 kW per rack but now running GPU clusters at much higher densities were not badly designed; they were designed for a different era. AFCOM data shows that average density has more than tripled between 2021 and 2026, and most operators expect this trend to continue.
The five practices above form a chain—each one only works if the previous one is in place. Bad measurements make every downstream decision unreliable. Unrecovered stranded capacity means you are buying infrastructure you do not need. Misaligned cooling turns hardware deployments into emergency retrofits. Poor airflow management bleeds efficiency from whatever cooling you do have. And without platform integration, none of it is visible until something breaks.
None of this requires a new facility or a full infrastructure refresh. It requires accurate measurements, an honest audit, and enough visibility to stay ahead of the problems rather than reacting to them.
