Data Center Environmental Monitoring: Tutorial & Best Practices

Data center environmental monitoring involves continuously tracking physical conditions—including temperature, humidity, airflow, water presence, and differential pressure (ΔP)—to protect equipment and ensure uptime. Effective monitoring also identifies overcooling and airflow inefficiencies that increase energy costs. These factors are critical for reliable hardware performance and cost-effective facility operations.
This article outlines five best practices for effective environmental monitoring in facilities using dedicated hardware integrated with a data center infrastructure management (DCIM) platform. The first two practices address data collection, the next two focus on interpretation, and the final practice covers applying insights to decision-making. Network performance, server health, and power quality are not discussed here.
Summary of data center environmental monitoring best practices
| Best practice | Description |
|---|---|
| Deploy sensors at the rack level | Deploy temperature and humidity sensors at the rack level, not just at the room level, so that you can detect localized hot spots before they damage equipment. |
| Expand sensor coverage beyond temperature and humidity | Monitor airflow, water leaks, differential pressure, and smoke so that you can catch the failure modes that temperature sensors alone will never see. |
| Configure tiered alert thresholds | Define warning and critical thresholds based on ASHRAE TC 9.9 guidelines, so your team gets advance notice of problems without being buried in noise. |
| Track trends, not just threshold violations | Monitor how environmental readings change over time to identify cooling degradation weeks before any alarms fire. |
| Integrate environmental monitoring with your DCIM platform | Connect sensor data to your DCIM platform so that temperature, power, and capacity readings sit in the same view and actually inform your decisions. |

netTerrain. Battle-tested & affordable DCIM Software
-

Manage data center floor plan, rackspace, cabling, power distribution, and more
-

Use analytics to optimize data center capacity and energy costs
-

Deploy quickly using asset discovery tools and pre-built integrations
Deploy sensors at the rack level
Most facilities start with room-level temperature sensors because they are easy to install and provide a single reference point. The problem is that this number often misleads: A room sensor measures only average temperature, so a rack reaching 35°C at the top may go unnoticed if a nearby wall sensor reads 22°C. Localized hot air pockets around racks do not mix quickly enough with ambient air to trigger room-level alerts.
This issue is common in practice. Hot spots caused by poor sensor placement often lead to unexpected hardware failures, even in monitored facilities. Equipment can fail without warning, and post-incident reviews frequently show that monitoring is focused on the wrong areas.
To address this issue, deploy temperature sensors according to the ASHRAE TC 9.9 protocol: Place them at the top, middle, and bottom of each rack, on both the front intake and the rear exhaust, for a total of six measurement points per rack. Use the cold-aisle intake as the primary reference, as server manufacturers specify inlet, not exhaust, maximum temperatures.
For racks under 5 kW, three front-mounted sensors are sufficient; for high-density racks, use all six points for complete vertical coverage. Sensors are reliable and immune to RF interference but require advanced cable routing plans, especially in congested spaces.
Wireless sensors deploy faster and scale easily, but correct gateway placement is crucial. A gateway behind metal cabinets creates difficult-to-diagnose dead zones. Make this choice before deployment, not during.
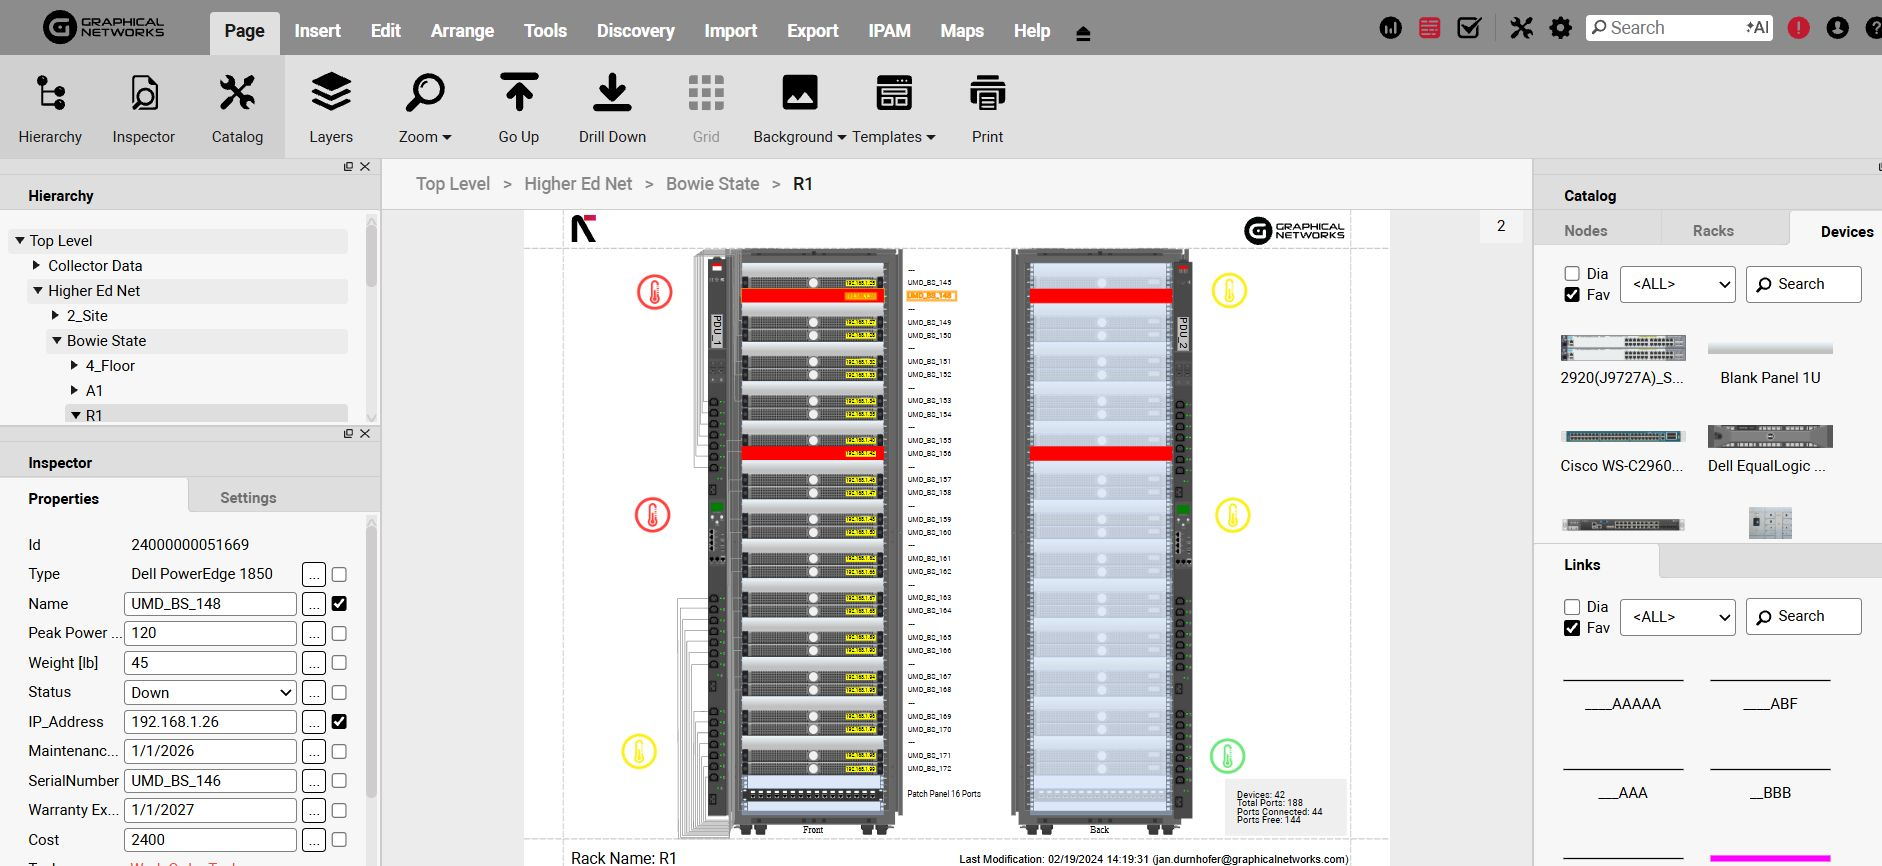
Here is a summary of the differences between wired and wireless sensors.
| Criteria | Wired | Wireless |
|---|---|---|
| Reliability | Higher: No signal dropout, immune to RF interference. | Lower: Susceptible to interference in dense metal environments. |
| Install effort | Higher: Requires a cable routing plan before deployment. | Lower: Faster to deploy, with no cable management needed. |
| Upfront cost | Higher: Cabling, conduit, and labor add up. | Lower: Hardware only with minimal installation labor. |
| Operating cost | Lower: No battery replacement or wireless maintenance. | Higher: Battery management becomes a real overhead at scale. |
| Scalability | Harder: Adding sensors requires new cable runs. | Easier: You can add sensors without touching existing infrastructure. |
| Best for | Stable, dense environments where long-term reliability matters. | Facilities with frequent reconfigurations or retrofit deployments. |
Expand sensor coverage beyond temperature and humidity
Monitoring temperature and humidity is essential, but it does not capture all critical failure modes. Expand sensor coverage to include airflow, water, differential pressure, and smoke to detect issues before temperature increases occur.
Airflow
Airflow is essential for temperature control. As cabling increases and equipment is added, air paths can become blocked, often going unnoticed until hot spots develop. Use one airflow sensor per cold air supply and one per hot air return to ensure effective cooling. In contained aisles with variable-speed fans, airflow differences may pull curtains inward, causing air leaks that compromise cooling before temperatures rise.
Water leak detection
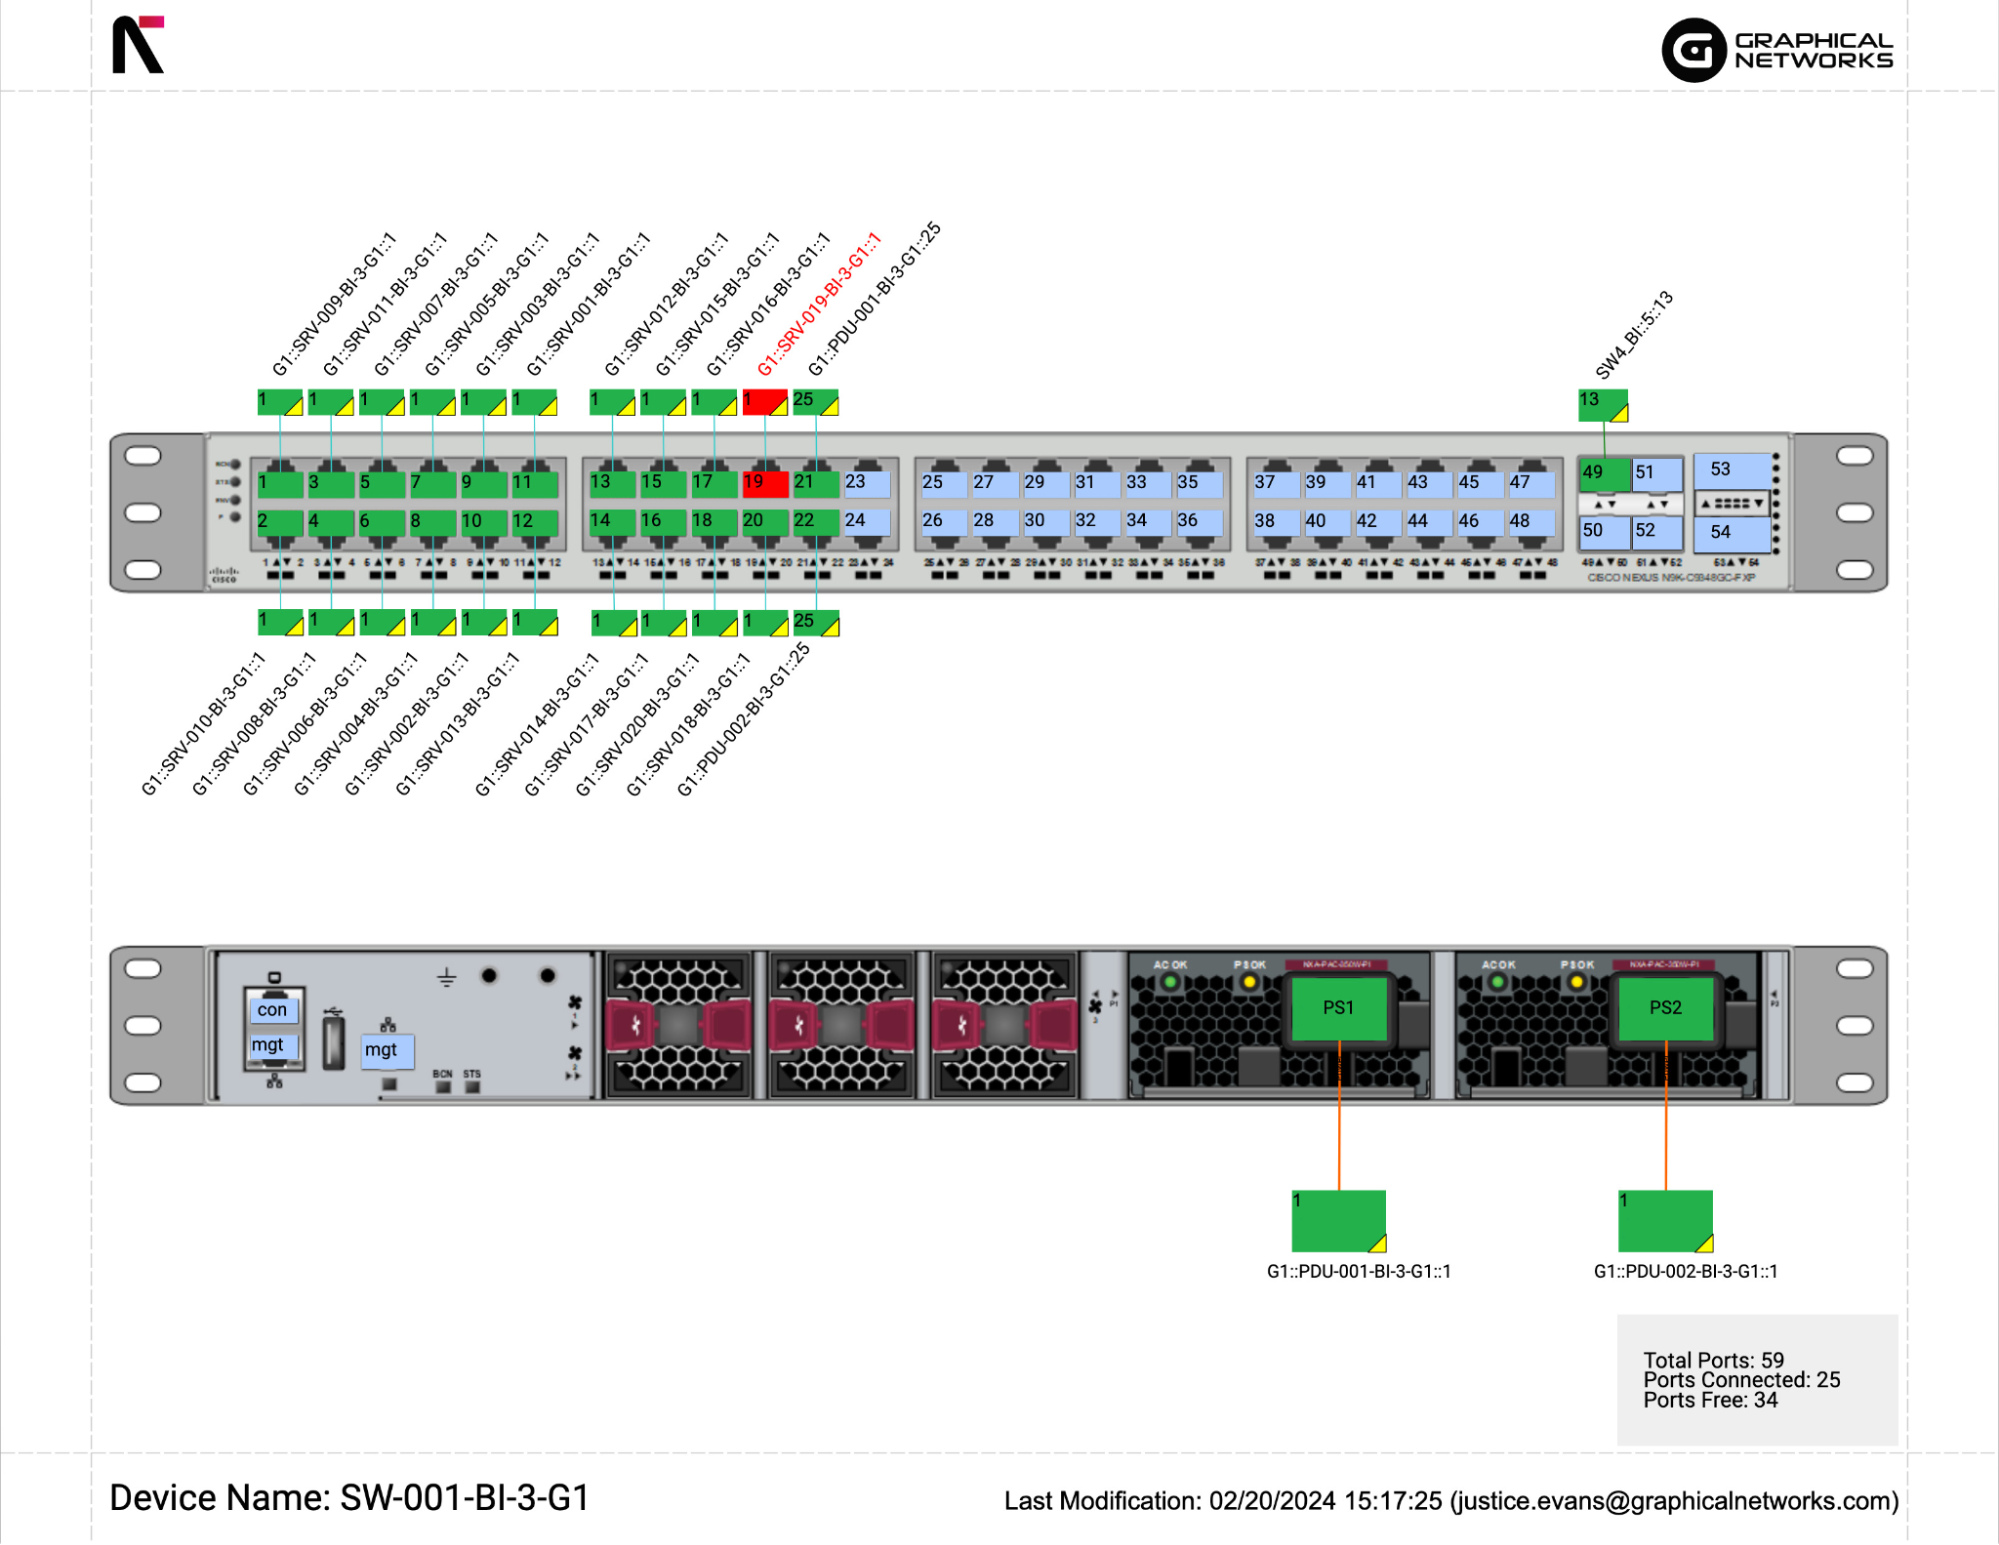
Facilities often address water leak risks only after an incident occurs. A CRAC unit leak under a raised floor may cool the immediate area before water spreads, causing local temperature sensors to show a drop rather than a rise. By the time temperatures increase, the leak has already spread. Install water leak detection (WLD) cables along the raised floor perimeter, under CRAC and CRAH units, and near mechanical equipment with water lines. Place spot sensors at floor low points as backups.
Differential pressure
Measuring the differential pressure between the hot and cold aisles shows whether your containment system is effective; temperature readings alone cannot confirm. A slight decrease in ΔP often signals issues such as missing blanking panels, open cable cutouts, or shifted containment curtains. Temperature changes appear later. The pressure drop provides early warning, allowing you to address issues before a thermal event occurs. Typically, one differential pressure sensor at mid-aisle height in each containment zone is sufficient.
Smoke detection
Smoke detection is your last line of defense before a rack fire becomes a room fire. Standard building smoke detectors are designed for open spaces and slow-developing fires. Electrical equipment fires inside a rack are fast and concentrated. Aspirating smoke detection systems such as very early smoke detection apparatus (VESDA) devices actively sample air through a pipe network, detecting particles before smoke becomes visible to standard detectors. Install roughly one per 50 to 100 square meters at ceiling height, but always defer to your local fire code.
Configure tiered alert thresholds
A single threshold creates binary outcomes: Either no issue is detected, or a problem has already occurred. By the time a single-threshold alarm activates, response time is limited. Instead, configure a two-tier alert model to receive early warnings and allow time to respond before equipment is at risk.
Use ASHRAE TC 9.9 as a reference
ASHRAE defines a recommended envelope for all equipment classes: an inlet temperature range of 18-27°C and a maximum relative humidity of 60% under typical conditions. The allowable envelope varies by equipment: Class A1 (most enterprise servers) covers 15-32°C and up to 80% humidity; class A2 extends to 35°C, A3 to 40°C, and A4 to 45°C, each reflecting greater thermal tolerance as tested by manufacturers.
One class worth calling out separately is H1, introduced in the 2021 fifth edition of the TC 9.9 guidelines. H1 covers high-density computing systems, including GPU servers and AI accelerators, and recommends a tighter 18-22°C band, with a ceiling of only 25°C.
If your facility runs mixed workloads, do not apply uniform thresholds across the floor. Set thresholds by rack type so that your AI and high-performance computing (HPC) rows operate within the H1 envelope while your standard server rows use the A1 limits. Most modern DCIM platforms support per-rack threshold configuration, which is exactly the use case this distinction was designed for.
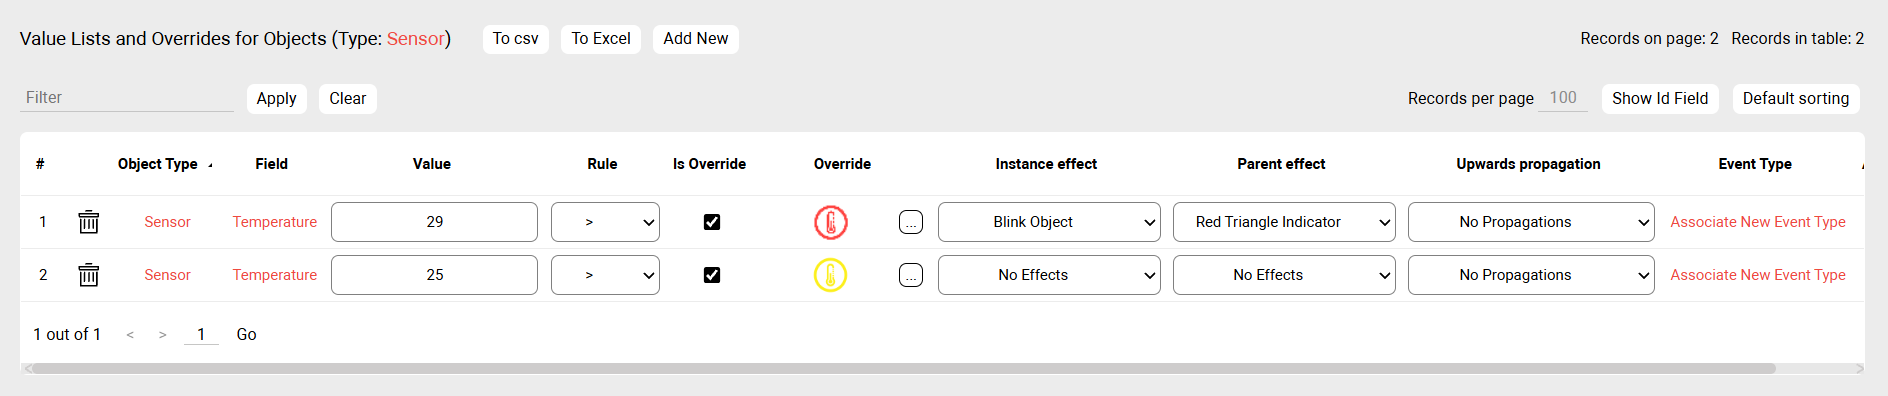
This table shows a practical starting point for most facilities running Class A1 equipment.
| Parameter | Warning Threshold | Critical Threshold |
| Rack inlet temperature | 25°C | 29°C |
| Relative humidity | 55% RH | 65% RH |
| Delta T (intake to exhaust) | +18°C | +22°C |
The rack inlet temperature and humidity thresholds above follow ASHRAE TC 9.9 Class A1 ranges. Delta T guidance is based on common practice rather than specific ASHRAE thresholds. Adjust these values according to your equipment class and operational baseline.
Overcooling is also a threshold problem
Proper thresholds directly affect energy use. Many facilities overcool by operating below ASHRAE’s recommended range out of caution, which wastes energy. Once rack-level sensors provide accurate temperatures, safely raise setpoints toward the recommended upper limit. This reduces cooling load without compromising equipment reliability.
Avoiding Alarm Fatigue
Aggressive thresholds generate excessive alerts, leading operators to ignore them and increasing the risk of missing real events. Start with wider bands and narrow them after collecting 30 days of data. Adjust thresholds seasonally if your facility uses air-side economizers or outside air, as baselines change throughout the year.
Track trends, not just threshold violations
The predictive maintenance parallel
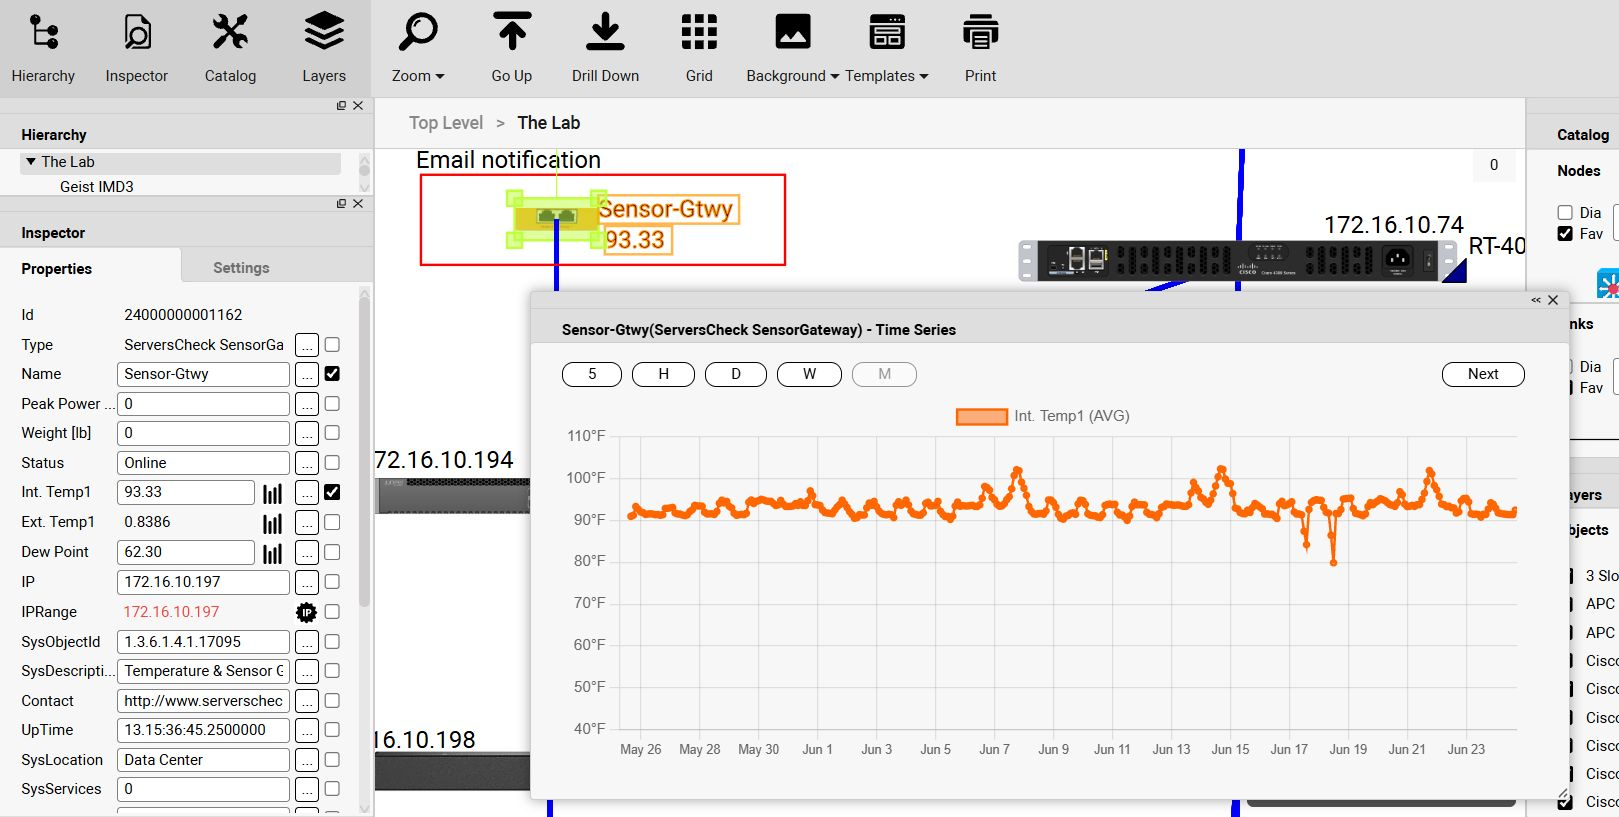
A sensor reading 26°C for three weeks may appear acceptable if thresholds are not crossed, but if it previously read 21°C, cooling has steadily declined without triggering alerts. Static thresholds do not reveal such trends. This principle is well established in predictive maintenance programs; for example, a gradual rise in vibration amplitude can signal bearing wear long before actual failure.
Experienced reliability engineers monitor trends, identify changes, and schedule maintenance proactively. The same approach applies to data center environmental monitoring. A slow increase in rack inlet temperature over several weeks indicates cooling degradation. This trend is visible before any alarm triggers, but only if you are monitoring it.
Delta T as a more stable health indicator
The difference between the intake and exhaust temperatures of a rack, ΔT, is a more reliable health indicator than absolute temperature alone. Since ΔT accounts for ambient changes, an increase over time usually indicates either increased heat generation in the rack or worsening airflow, regardless of room temperature. Monitor ΔT per rack to identify potential issues before they escalate.
Building the habit
Begin by recording at least 7 to 14 days of normal operation before defining baseline conditions. Document any major workload changes or HVAC events during this period to distinguish real changes from normal variation, then add a weekly trend review to your routine. Spending fifteen minutes reviewing the past week’s rack inlet temperatures in key rows will provide more valuable insights than most alert systems.
Trend visibility enables proactive management rather than simple reaction to problems. For example, if a zone consistently operates 8°C below the ASHRAE limit, you can safely raise the cooling setpoint, saving energy without compromising reliability. This approach shifts focus from risk management to operational improvement. A DCIM platform with real-time analytics supports this process.
Integrate environmental monitoring with your DCIM platform
If you observe a temperature spike on a standalone monitoring dashboard, you know an area is hot but lack context about which assets are at risk, whether a workload change caused it, or if power use has increased. This context is available in your DCIM platform. Without it, you are limited to reacting to alarms rather than identifying the underlying issue.
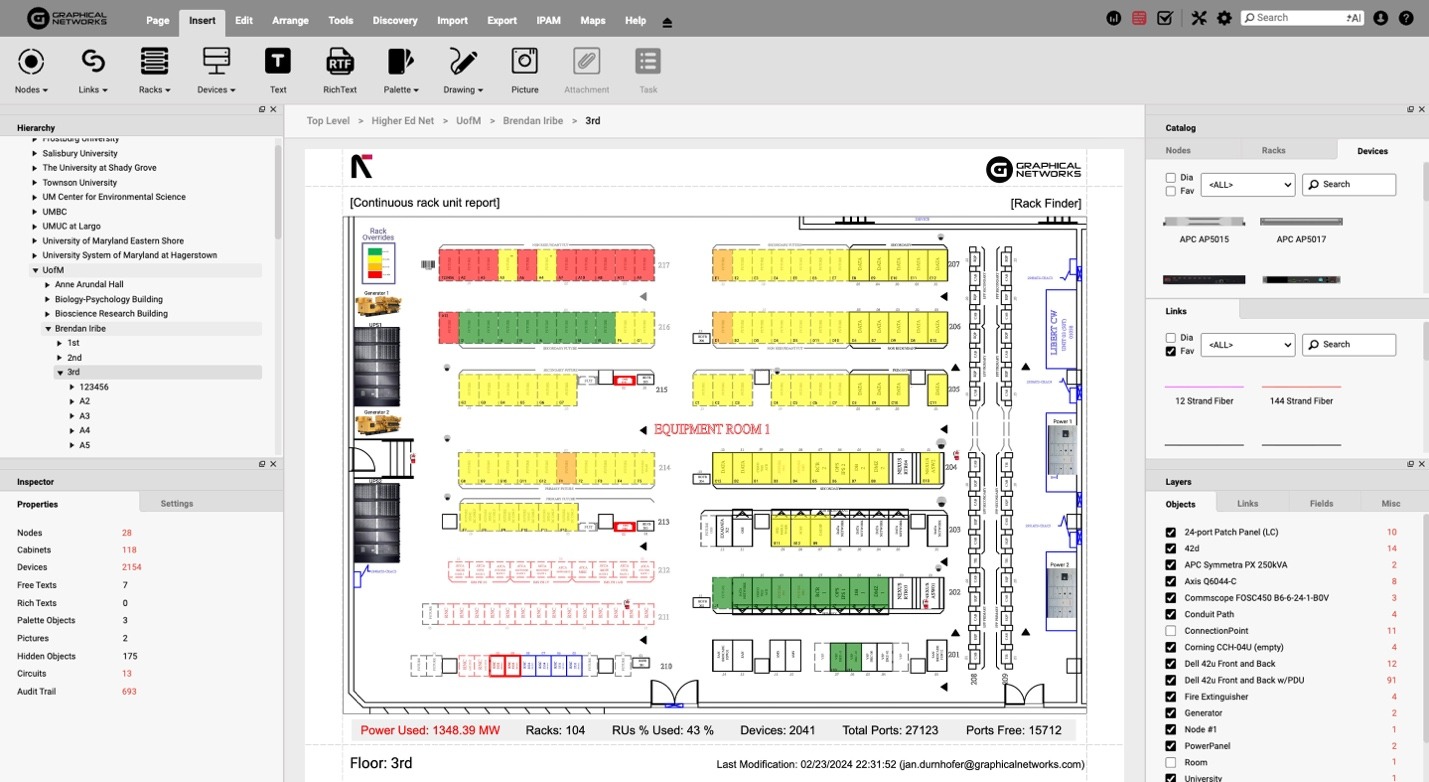
Integrate environmental monitoring with your DCIM platform to view rack temperature, humidity, and airflow alongside asset inventory, power use, and capacity. During a thermal event, you can quickly identify the affected rack, its utilization, and recent changes. The platform also directs alerts to the appropriate personnel based on asset involvement.
From incident response to operational optimization
The benefits extend beyond incident response. Viewing environmental trends alongside power and capacity data enables optimization rather than simple reaction. You can identify consistently overcooled racks, areas where additional cooling is ineffective, and correlations between rising power use and temperature changes, allowing for proactive capacity planning. This approach helps reduce energy costs and improve power usage effectiveness (PUE), making your data more valuable.
A note on integration protocols
Most environmental monitoring hardware uses standard protocols, so custom development is unnecessary if your DCIM platform supports them. The Simple Network Management Protocol (SNMP) is common for older sensors, rack PDUs, and monitoring controllers. Modbus is typical for CRAC and CRAH units and other industrial cooling equipment. Newer IoT sensors often use Message Queuing Telemetry Transport (MQTT), which is lighter, event-driven, and better suited to high-density environments where polling is challenging. If your DCIM platform supports all three, you can consolidate data without first standardizing hardware.
For configuration, use the platform interface to set up environmental monitoring rather than scripting. Generic protocol commands lack the device-specific details required for effective setup, so this article does not include code examples.
Infrastructure clarity for organizations across all industries
Conclusion
Effective data center environmental monitoring is an ongoing process. Its value depends on regular data collection, accurate interpretation, and integration with a platform that supports informed decisions about reliability and efficiency.
These five practices are complementary: Accurate rack-level monitoring provides reliable data, tracking additional parameters helps identify issues that temperature alone may miss, tiered thresholds allow time to respond, trend monitoring uncovers problems that static alarms cannot, and DCIM integration ensures that this information is actionable for infrastructure and energy management.
If you are just starting, focus on two priorities: deploying rack-level temperature sensors and ensuring integration with your DCIM platform. These steps lay a foundation for future expansion, enabling you to add more parameters and analytics as your program evolves.
