Need an easier way to document and map your fiber backbone? netTerrain OSP*, our outside plant management platform, is used by our customers to manage their inside and outside plants — from fiber splices to manholes to GIS-enabled street views (with 6-decimal precision) all the way to fiber patch panels inside buildings.
This blog series takes a look at what you can map with our fiber plant software and how easily you can work with it.
In this introduction to the series, (click here for the video version of this blog), we will:
- Create a dynamic map from scratch — in netTerrain, using OpenStreetMap (the tool we use for rendering dynamic maps)
- Show you how easy it is to navigate around the maps you create
![]()
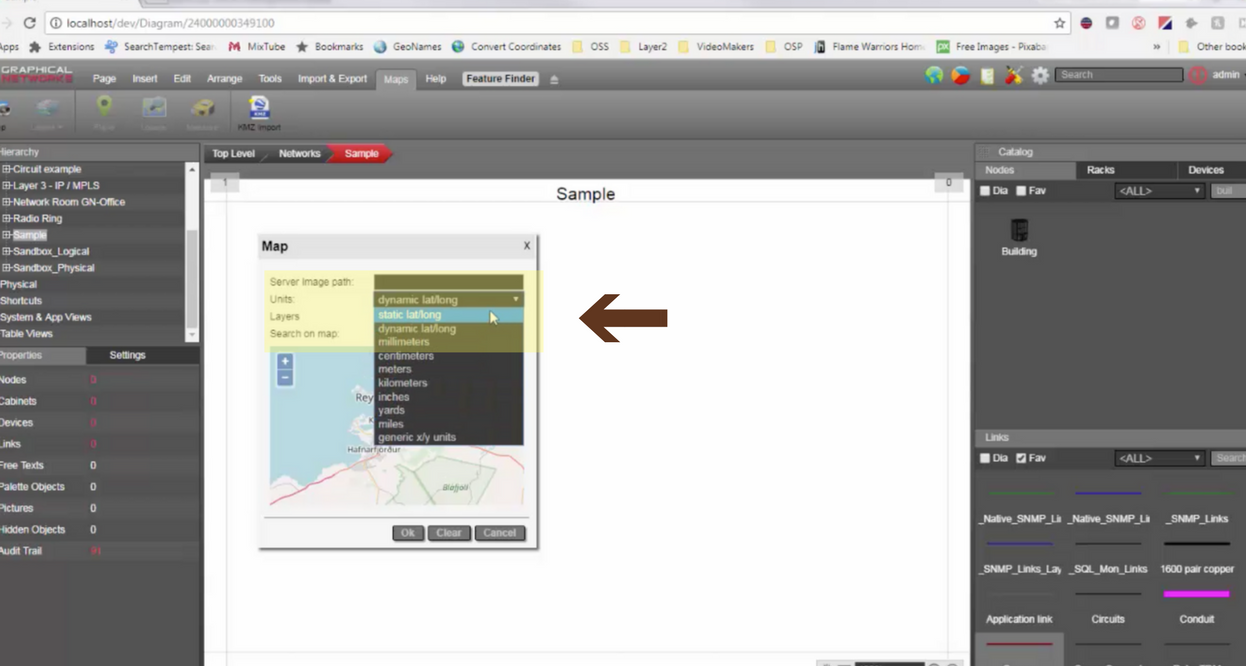
We’ll start with a completely empty diagram (see above image) and add a dynamic map to it.
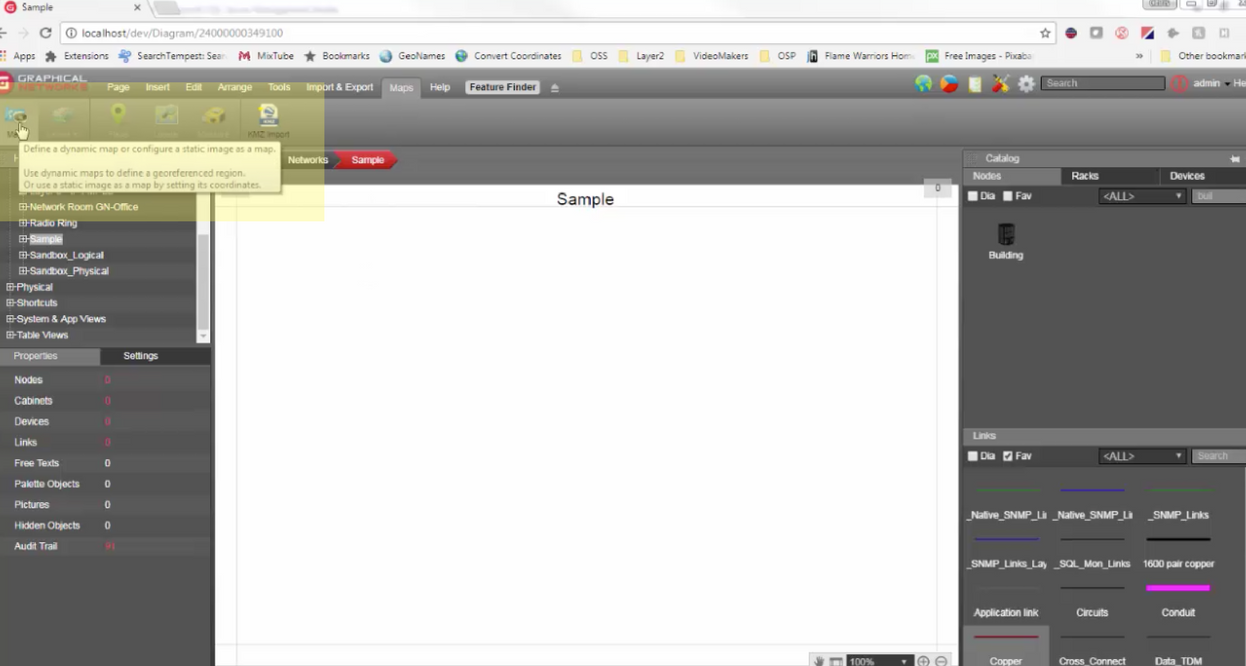
To do this, click on the ‘maps menu’ in your ribbon (as in above image) and you’ll see the map button: you can also get to the map button by right-clicking on a diagram. Once you click on the map button, you can choose the specific map you need.
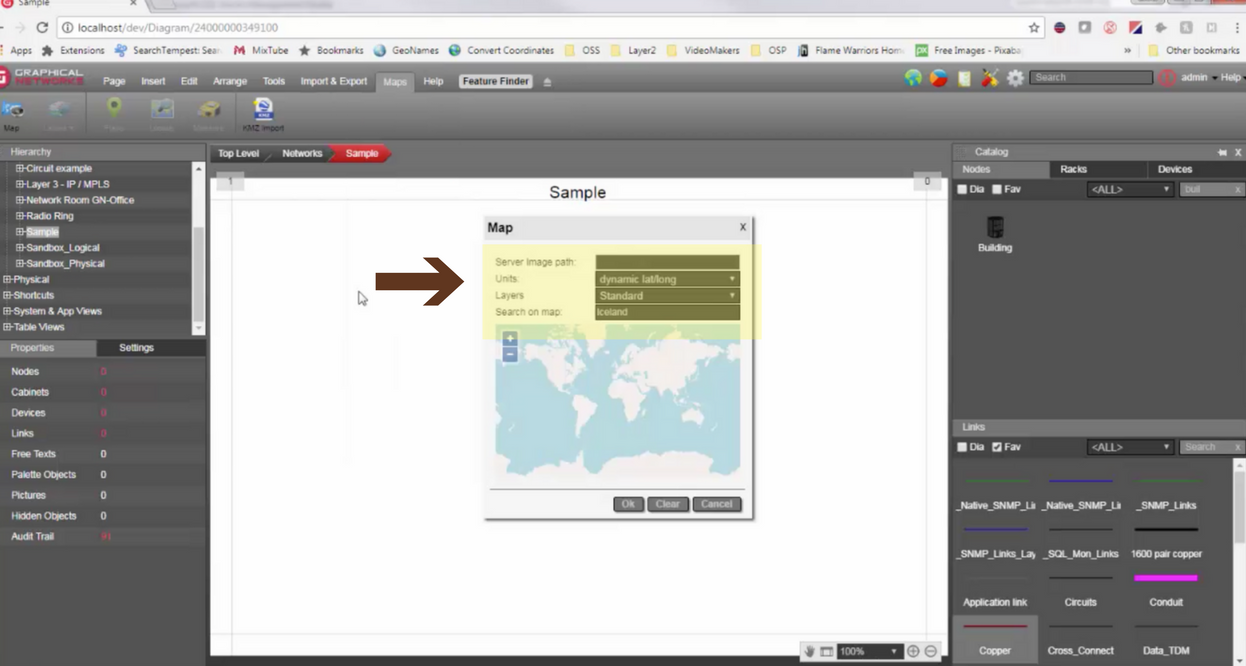
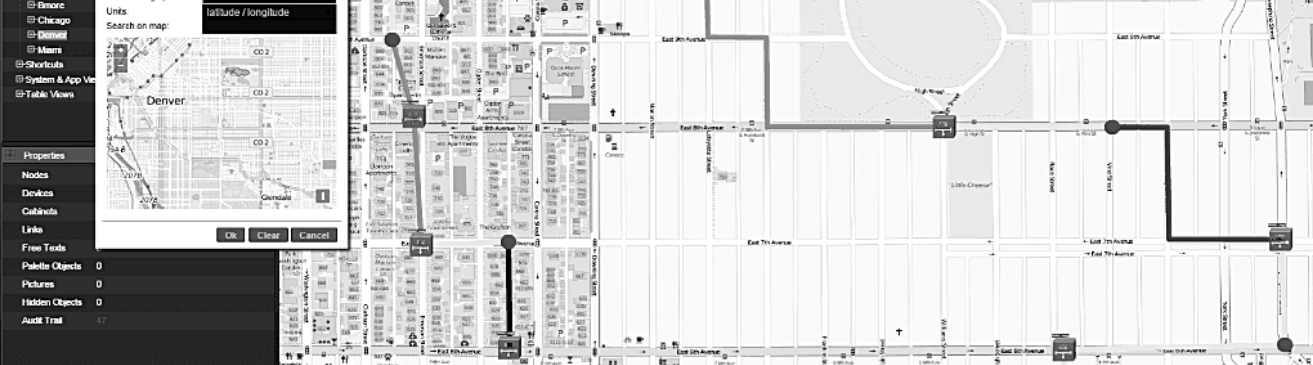
For this demo, we’ll work in Iceland (because I’ve always wanted to visit) — and add some objects into the capital city of Reykjavik. At this point, make sure the ‘units’ here are set to a dynamic latitude and longitude — without this set, your map is static (see image above). With a static map, you can still set your coordinates — but it’s not going to be a dynamic map created using OpenStreetMap.
In general with netTerrain OSP, you’ll use dynamic network maps (not static) for managing your objects in large geographical areas (‘dynamic’ refers to OpenStreetMaps (aka GIS maps or geo-referenced maps). netTerrain’s dynamic network maps have coordinates attached: you can zoom in and see your locations in great detail.
To give you some background, OpenStreetMap is an open-source mapping technology widely used around the world with millions of users. It’s the ‘Wikipedia of Maps’ as it doesn’t require any royalties for usage, you can use as many as you want, and you can even contribute to the map (any changes you contribute will be automatically reflected in netTerrain).
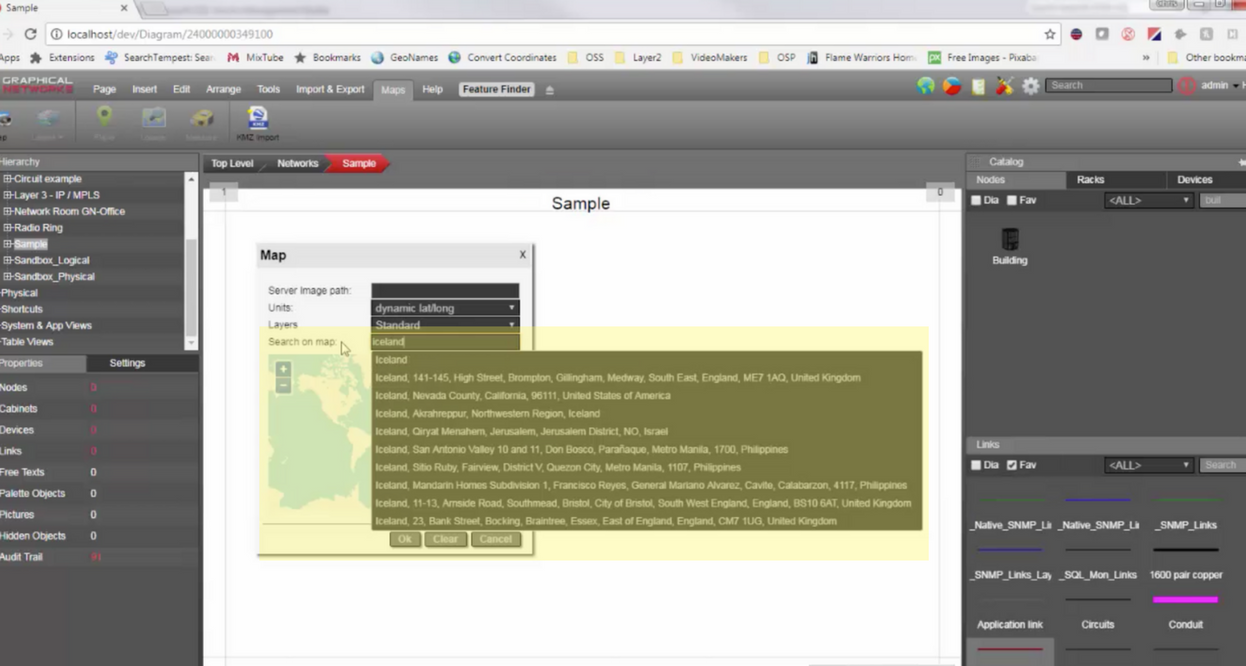
Need to find something specific? You can search by any criteria you put in: your options are endless.
Want to add layers or change your map’s appearance? You have three different layers you can use:
Standard Layer
This is our most used one and it has most of the labels here, such as street names.
Transport Layer
As the name suggests, the transport layer is more geared towards highlighting highways, railways, and so on.
Light Layer
The light option is as it sounds: it’s not as crowded and doesn’t have as many labels.
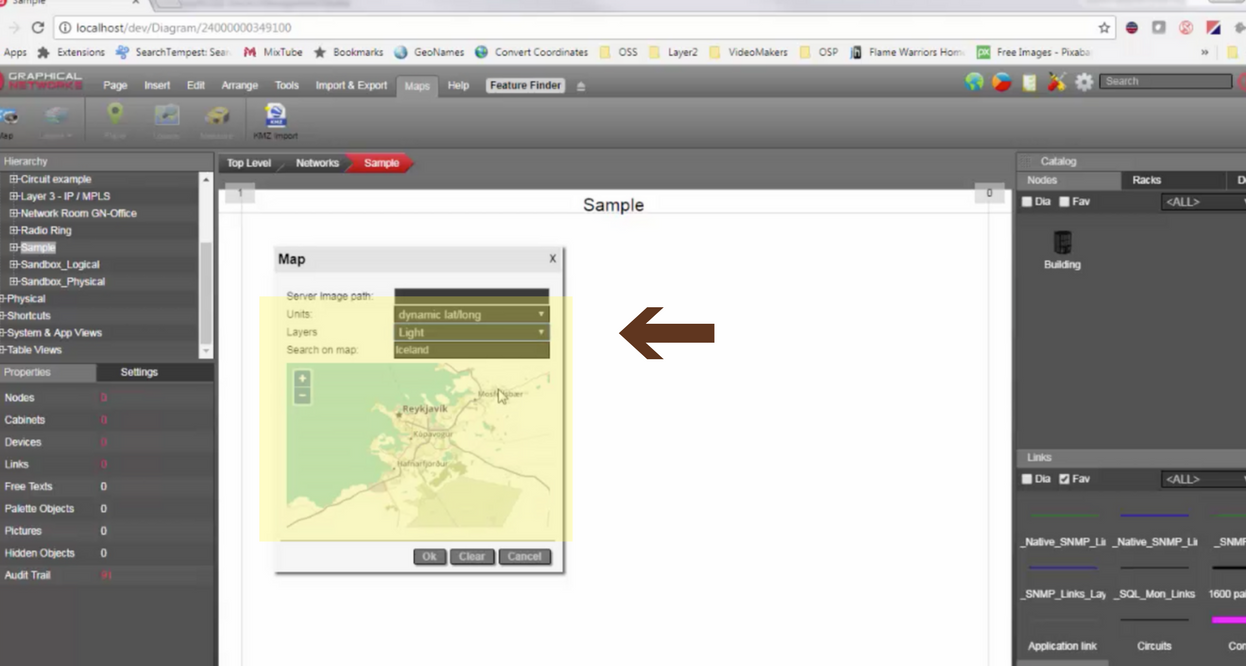
For this demo, we’ll use a standard layer (shown above). Though the map you select here defines the boundaries of your dynamic map, changing these boundaries is simple: you can just go back in and select a larger area without losing any of your work. netTerrain will automatically recompute the position of the objects that already existed on a diagram once you make a change.
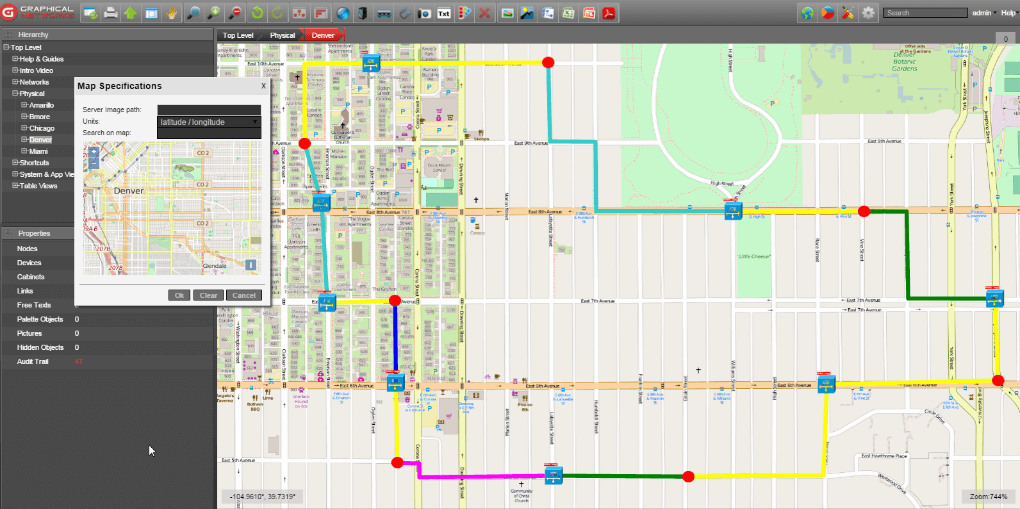
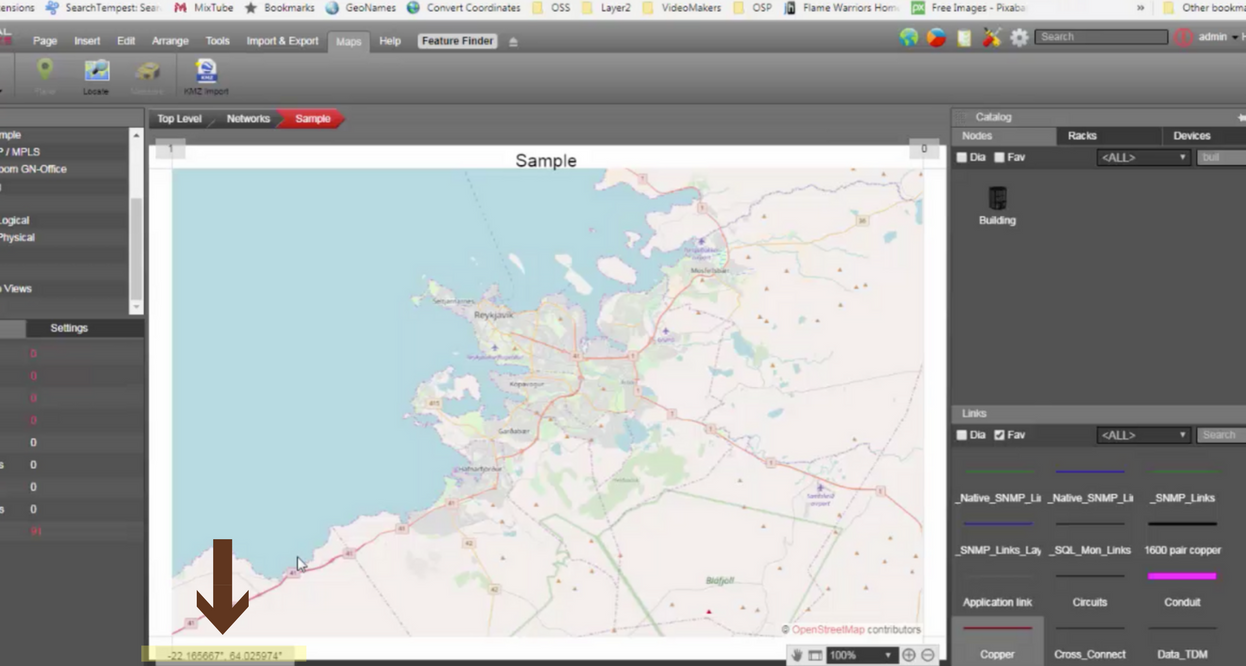
So, we’ve now created a dynamic map of the capital of Iceland. The coordinates are on the bottom left corner (see image below). We provide up to 6 decimal places for our lat/long coordinates. As always, you can zoom in: as you zoom in, you’ll see the details emerging – street names, houses, and so on (see the video for more specifics).
I created this map while working online, however: you don’t have to be connected to the Internet to use netTerrain OSP. Working offline is simple: just download some of the maps, or even the entire world, from an openstreetmap server. You can regenerate them in your own local database if you need to (and we’ll provide you with the steps for doing that).
Locating a place is easy with the locate button. Looking for a certain street? Just click on the button and you’re there.

Of course, you can do far more than find general places on the map. You can find objects — from manholes to fiber splices (and much more). Stay tuned: we will explore all of the OSP features in blogs to come.
[divider height=”30″ line=”1″]* netTerrain OSP is one of the products in the netTerrain IT visualization suite, which includes: DCIM, network mapping, and data center power monitoring solutions.