 When it comes to maintaining and managing an IT infrastructure, network diagrams are critical to compliance, security, troubleshooting, and minimizing downtime. Network diagrams, or maps, are visuals that use symbols/icons/shapes to depict the different objects and connections in a network. Depending upon what you need to document, you may will probably have different types of network diagrams. The two most common network diagrams you’ll come across are physical and logical.
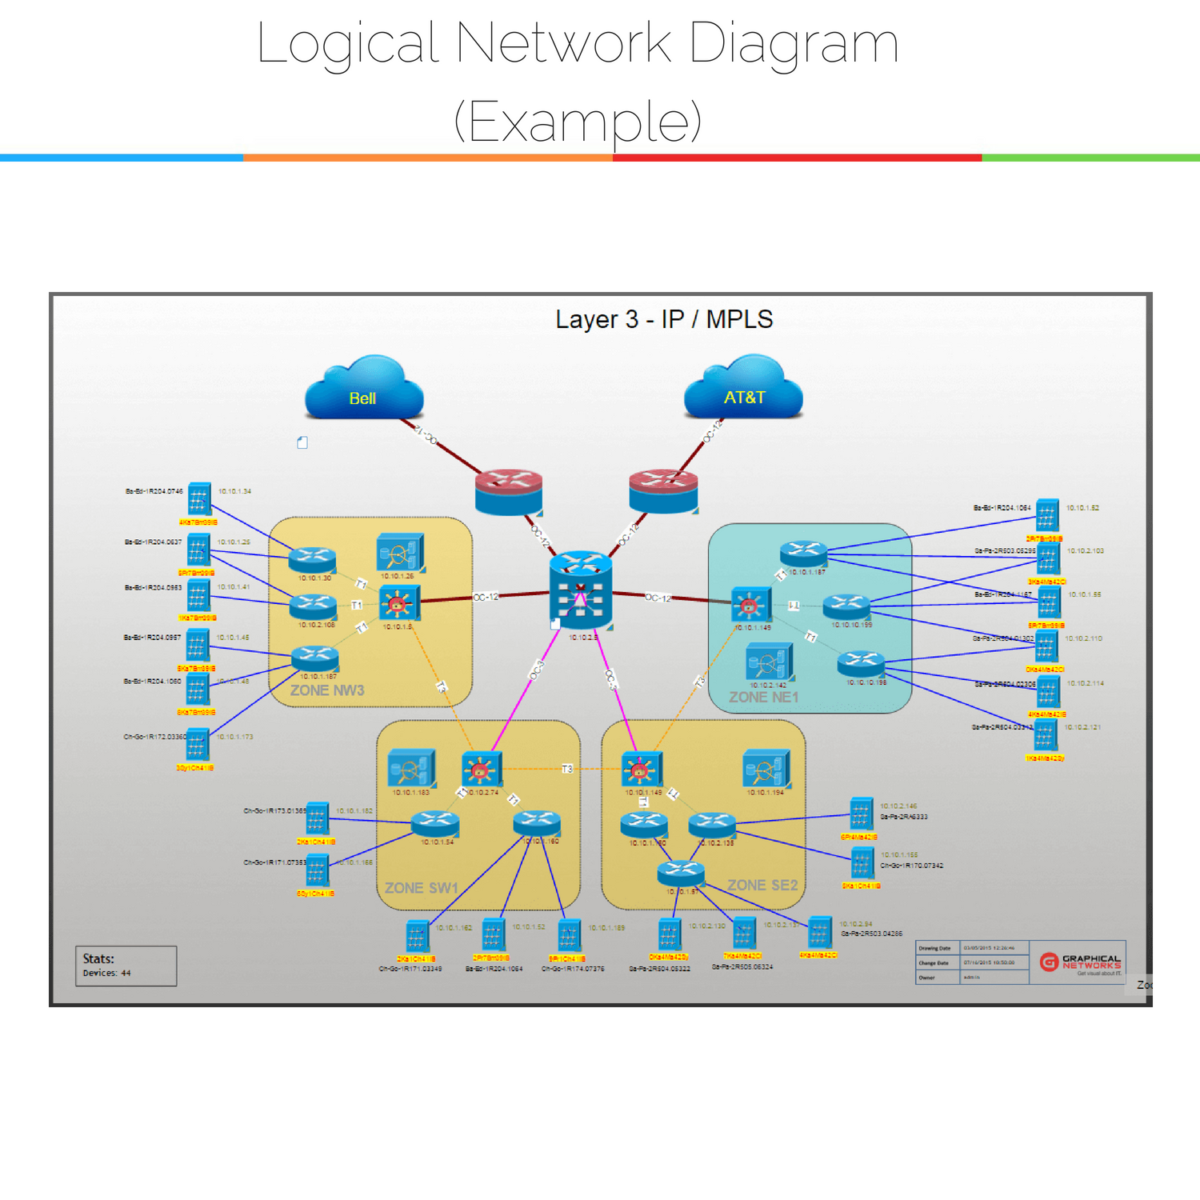
Logical network diagrams focus in on how traffic flows across the network, IP addresses, admin domains, how domains are routed, control points, and so on. Within the OSI model of networking, logical diagrams are referred to as ‘L2’.
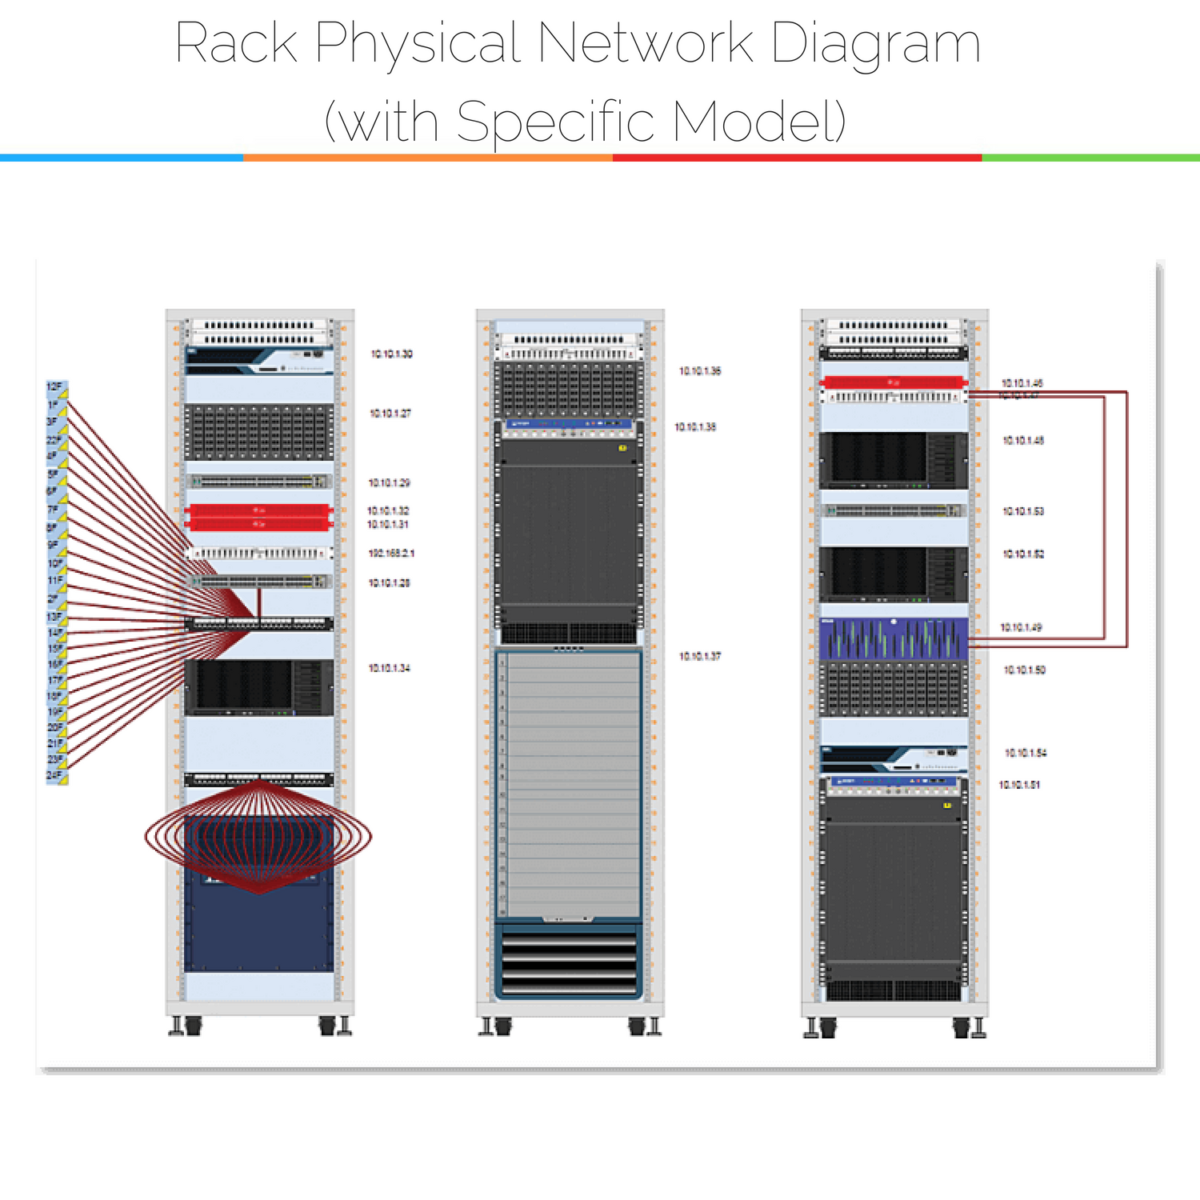
A physical network diagram will, ideally, show the network topology exactly as it is: with all of the devices and the connections between them. Because physical diagrams depict all of the physical aspects of the network, they will likely include: ports, cables, racks, servers, specific models, and so on. Within the OSI model of networking, physical diagrams are referred to as ‘L1’. So, a physical network diagram could be a network’s server diagram, a network’s cabling diagram, racks diagram, or a mix of different types of diagram that is interactive and allows you to view what you need to see (if you’re using automated mapping software).
Physical Network Diagrams: What’s In Them?
Because physical network diagrams depict the entire topology of the physical network, they can include a number of different components:
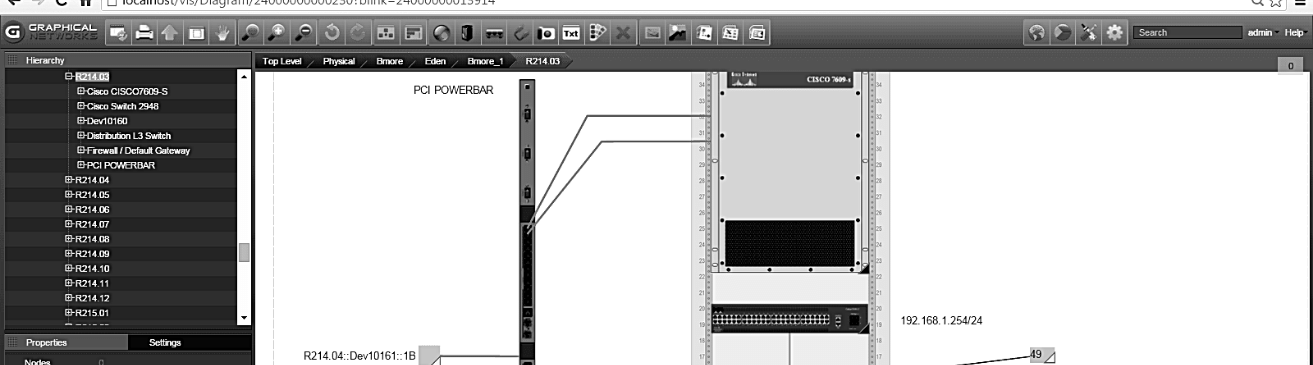
- Connections:connections are critical to a physical network diagram. Connectors (aka connections) depict the physical cabling that connects physical devices in a network. The ends of each connection should be labeled both with whichever port it connects to and where it ends.Depending upon the level of detail required, you may use different colors, thickness, and types of lines to represent differences in connections: such as fiber, copper, and so on.
- Labels:Labels tell the viewer what they are looking at, especially when a physical diagram uses generic icons. Everything that is active and managed in the network should be labeled with the hostname and IP address, including: switches, routers, firewalls, and so on. When a device is active and being managed elsewhere, it should still be labeled in some way (perhaps with a different font to differentiate it from the other network devices).
- Diagram Legend: a diagram’s legends tells the viewer what the different objects and connections mean. The legend translates the different graphics, icons, colors, and gives it real-world meaning. If, for example, you use double black lines to represent a type of fiber cabling — you would include this in your legend.
- Switch Stacks: switch stacks, that function similar to a chassis switch, are generally depicted as a single object/device.
Physical Network Diagrams: Shapes, Symbols, or Models?
How you depict the physical network and connections is up to you and the needs of your organization: you can be as general (for example, using generic topology icons) or specific (use exact device models as icons) as needed. Using generic topology icons can be more easily read by anyone; specific models of devices (exact models that include fans, rack ears, and ports, for example) may require more familiarity with exactly what is in a given network. If you are using DCIM or network documentation software, you may choose to use the generic icons for higher-level layers and more specific icons/models as you drill down.
![]()
Physical Network Diagrams: How are they Created?
You can create physical network diagrams in a variety of ways: by hand, using software such as Visio, or with a dedicated network diagramming or DCIM software. While Visio or hand-drawn network diagrams may work for small networks, one of the keys to successful network documentation is ongoing documentation. If you are managing a larger network with any complexity, you may want the ability to automatically generate network diagrams with a few clicks, based on real-time data.
Bottomline? Without physical diagrams of the network, it’s hard to quickly plan for capacity, fix problems, avoid zombie servers, and IT clutter. If you are trying to use spreadsheets or static Visio diagrams, it may be time to look at upgrading to an enterprise-grade diagramming software specifically for network documentation.